Fig. 1.
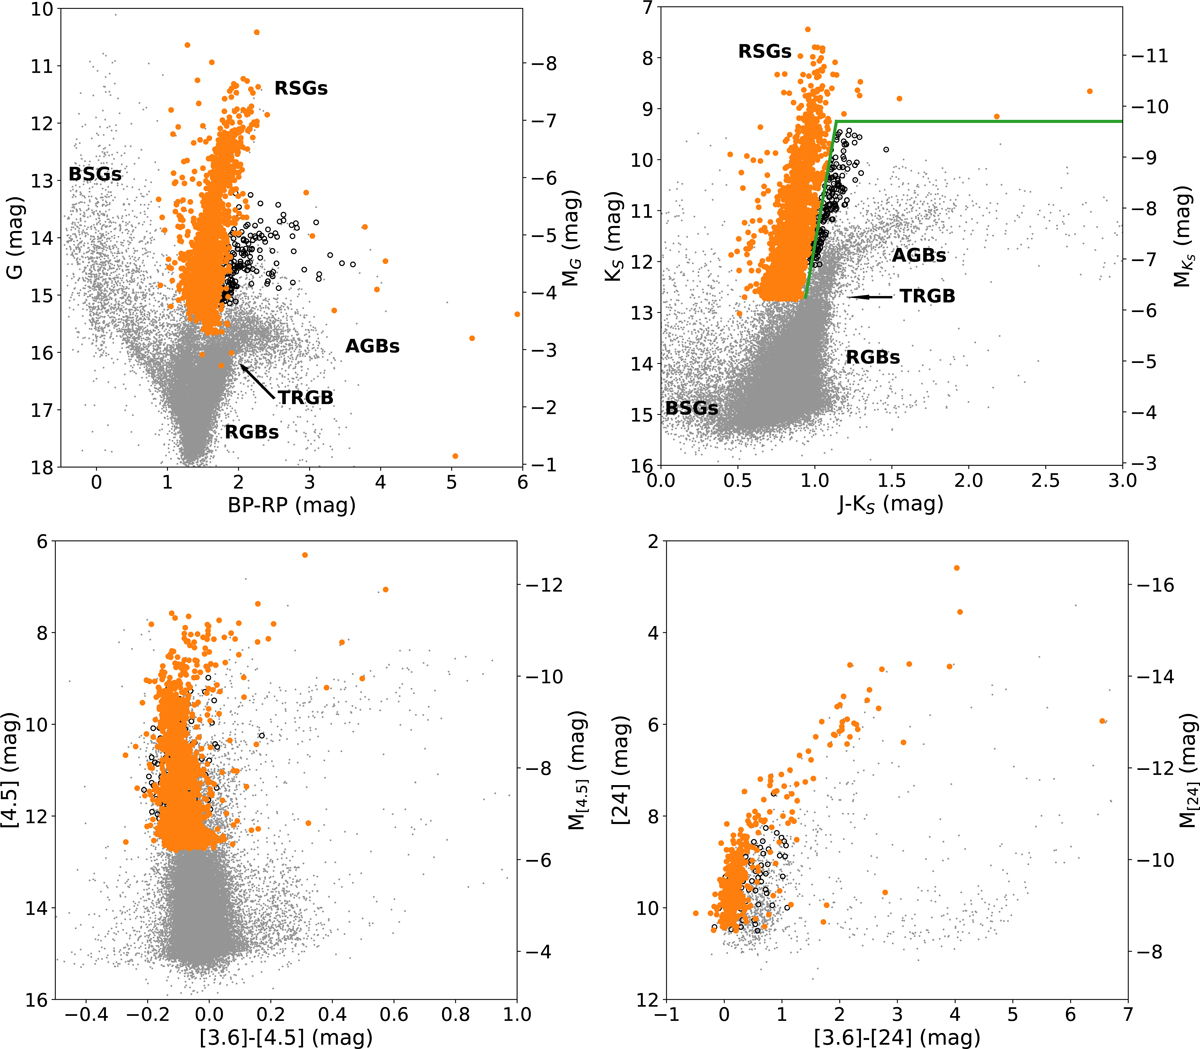
Download original image
Gaia (upper left), 2MASS (upper right), IRAC (bottom left), and MIPS (bottom right) CMDs of the final RSG sample in the SMC. Targets in the overlapping region (green lines) between AGBs and RSGs on the 2MASS CMD are removed (open black circles). Other general stellar populations, e.g., AGB, RGB, TRGB, and BSG stars, are marked on the Gaia and 2MASS CMDs, but not on IRAC and MIPS CMDs due to the overlap between different populations (see Fig. 12 of Yang et al. 2021a). Background targets (gray dots) are from Yang et al. (2019).
Current usage metrics show cumulative count of Article Views (full-text article views including HTML views, PDF and ePub downloads, according to the available data) and Abstracts Views on Vision4Press platform.
Data correspond to usage on the plateform after 2015. The current usage metrics is available 48-96 hours after online publication and is updated daily on week days.
Initial download of the metrics may take a while.