Fig. 3
Download original image
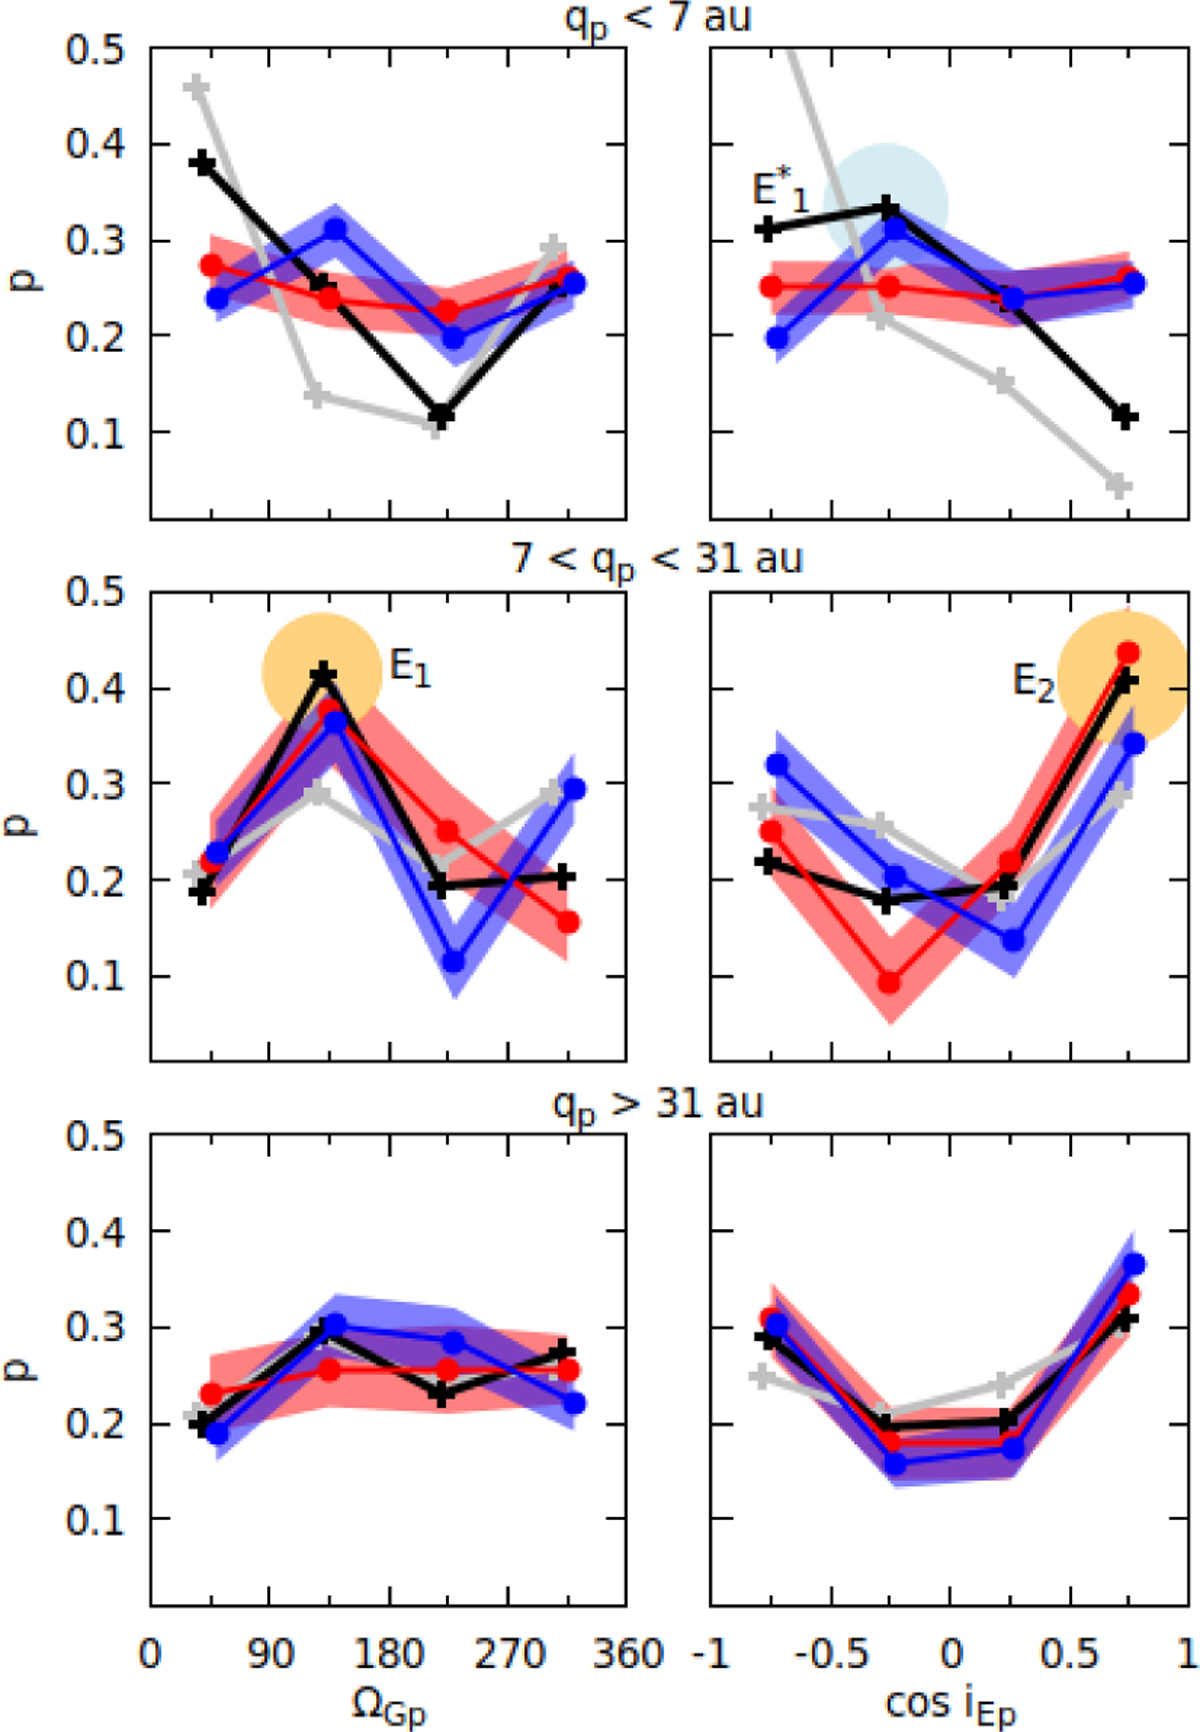
Distributions of ![]() (left column) and cos (
(left column) and cos (![]() , cos
, cos ![]() ) (right column) for the three different q zones from top to bottom (see the main text for details). Red lines (with error bars) correspond to the comets stored in the CODE databases and blue lines to the MPC database. The black and gray lines (without error bars) correspond to the disk and isotropic models, respectively. The patches indicate the KQ (blue) and EE (orange) features of interest.
) (right column) for the three different q zones from top to bottom (see the main text for details). Red lines (with error bars) correspond to the comets stored in the CODE databases and blue lines to the MPC database. The black and gray lines (without error bars) correspond to the disk and isotropic models, respectively. The patches indicate the KQ (blue) and EE (orange) features of interest.
Current usage metrics show cumulative count of Article Views (full-text article views including HTML views, PDF and ePub downloads, according to the available data) and Abstracts Views on Vision4Press platform.
Data correspond to usage on the plateform after 2015. The current usage metrics is available 48-96 hours after online publication and is updated daily on week days.
Initial download of the metrics may take a while.