Fig. 1
Download original image
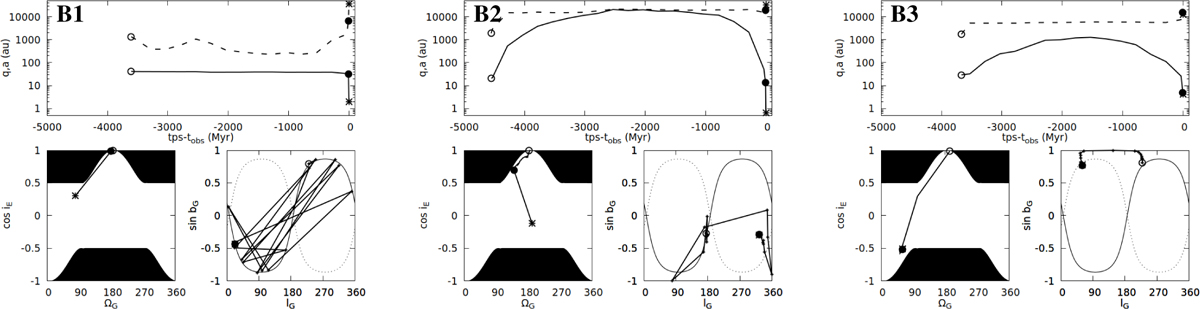
Long-term evolution of observable comets. The time is given in millions of years before the time of observation. The open circles correspond to the initial position, the filled circles correspond to the original orbit at the perihelion preceding the observation, and the stars correspond to the original orbit when the comet is observable. The evolution is given by one point every 250 Myr. For each panel, the upper diagrams show the evolution versus time of the semimajor axis (dashed line) and perihelion distance (full line); the two lower diagrams are, from left to right, the motion of the comet in the (ΩG, cos iE) plane and in the (lG, sin bG) plane. The black region in the (ΩG, cos iE) plane is a forbidden region. In the (lG, sin bG) plane, the full black curve and the dashed black curve are, respectively, the trace of the ecliptic plane and the EE plane. The boldface letter in the upper-right corner of each panel refers to the long-term behavior described in the main text.
Current usage metrics show cumulative count of Article Views (full-text article views including HTML views, PDF and ePub downloads, according to the available data) and Abstracts Views on Vision4Press platform.
Data correspond to usage on the plateform after 2015. The current usage metrics is available 48-96 hours after online publication and is updated daily on week days.
Initial download of the metrics may take a while.