Fig. B.1.
Download original image
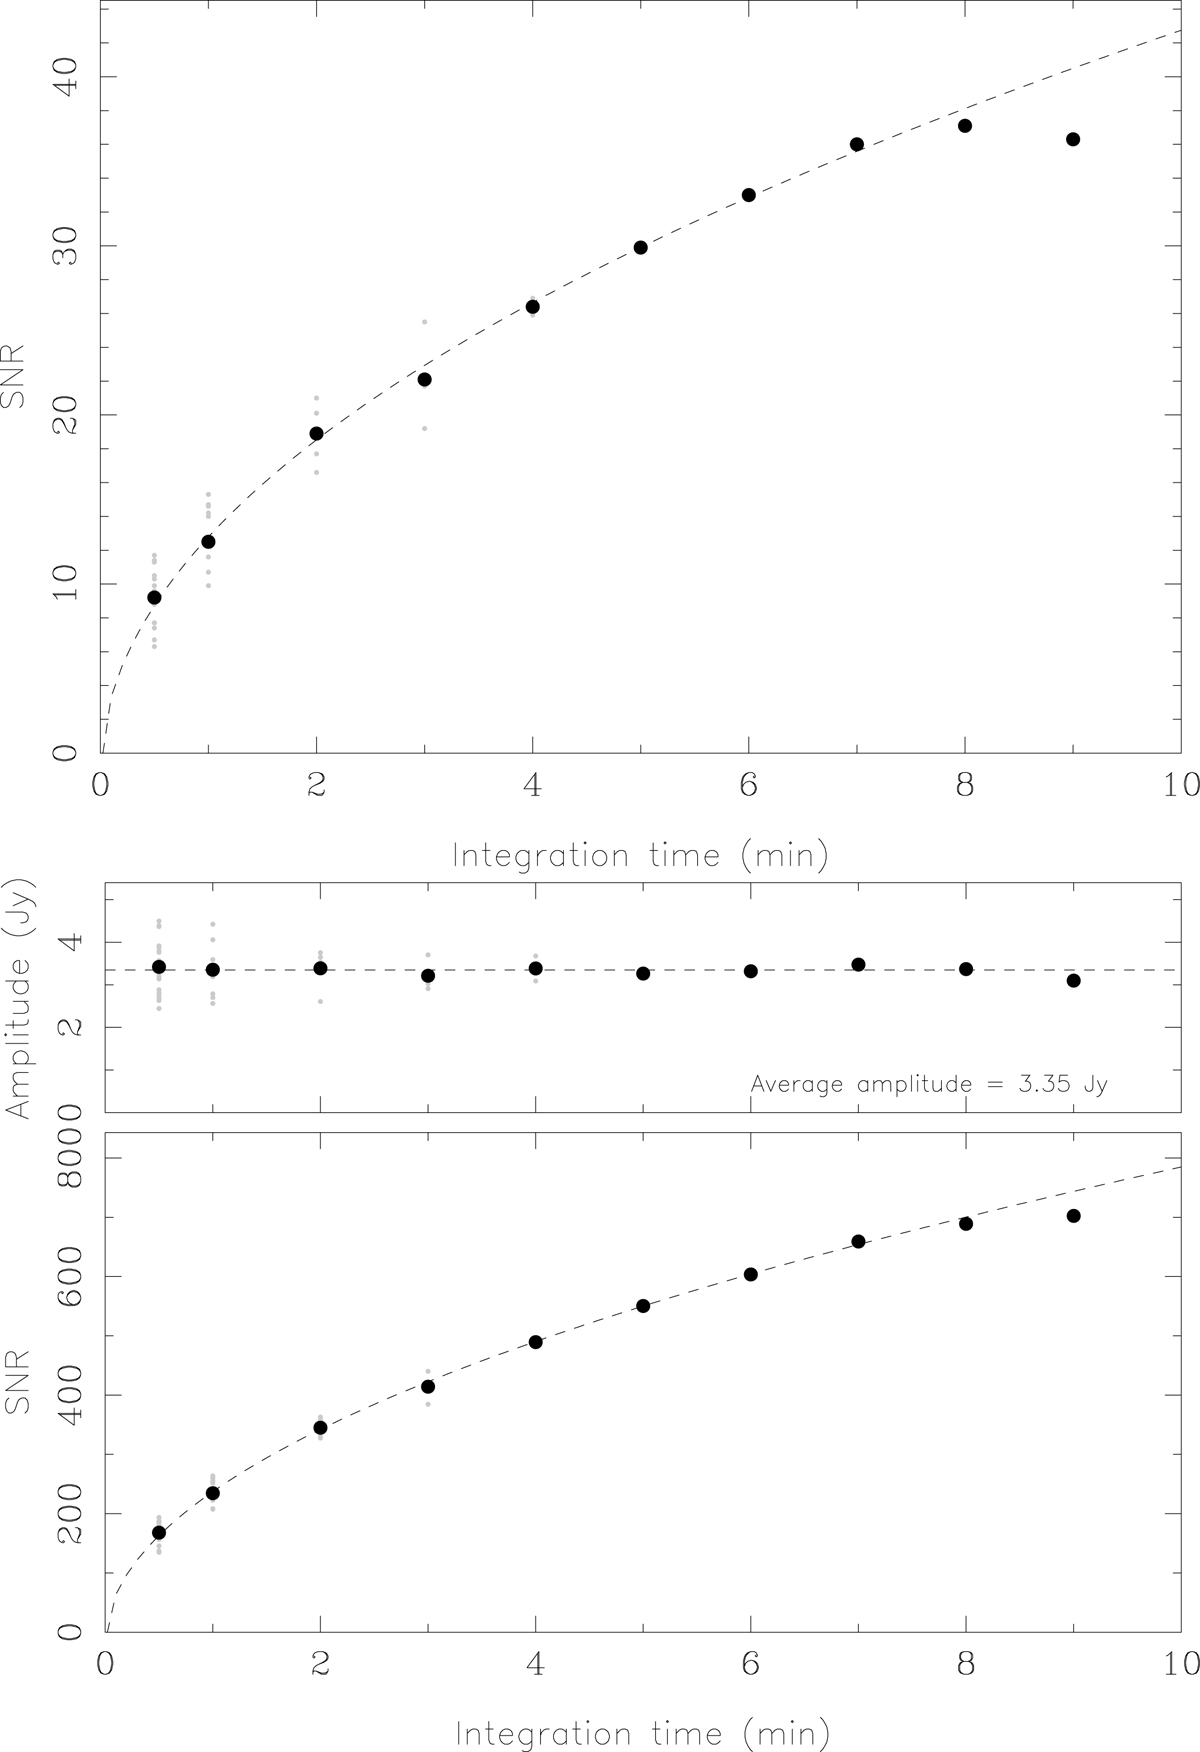
Coherence plots for the Space Radio Telescope at 22 GHz. The data shown are for the time interval 17:23:00−17:33:00 UT. Top panel: S/N in the FFT fringe search step of a global fringe fitting algorithm as a function of integration time. Grey dots show the S/N of individual solutions, while large black dots indicate the averages. The dashed line shows the expected ![]() -dependence of the S/N. The data starts to deviate from the dashed line at ∼8 min integration time, which marks the maximum averaging time that still improves the S/N. Longer averaging times do not improve the S/N because of increased coherence losses due to a drifting visibility phase. Middle panel: Average visibility amplitude (after applying the corresponding fringe fit solutions). Bottom panel: S/N after the least-squares minimisation step of a global fringe fitting algorithm as a function of integration time. Symbols are the same as in the top panel.
-dependence of the S/N. The data starts to deviate from the dashed line at ∼8 min integration time, which marks the maximum averaging time that still improves the S/N. Longer averaging times do not improve the S/N because of increased coherence losses due to a drifting visibility phase. Middle panel: Average visibility amplitude (after applying the corresponding fringe fit solutions). Bottom panel: S/N after the least-squares minimisation step of a global fringe fitting algorithm as a function of integration time. Symbols are the same as in the top panel.
Current usage metrics show cumulative count of Article Views (full-text article views including HTML views, PDF and ePub downloads, according to the available data) and Abstracts Views on Vision4Press platform.
Data correspond to usage on the plateform after 2015. The current usage metrics is available 48-96 hours after online publication and is updated daily on week days.
Initial download of the metrics may take a while.