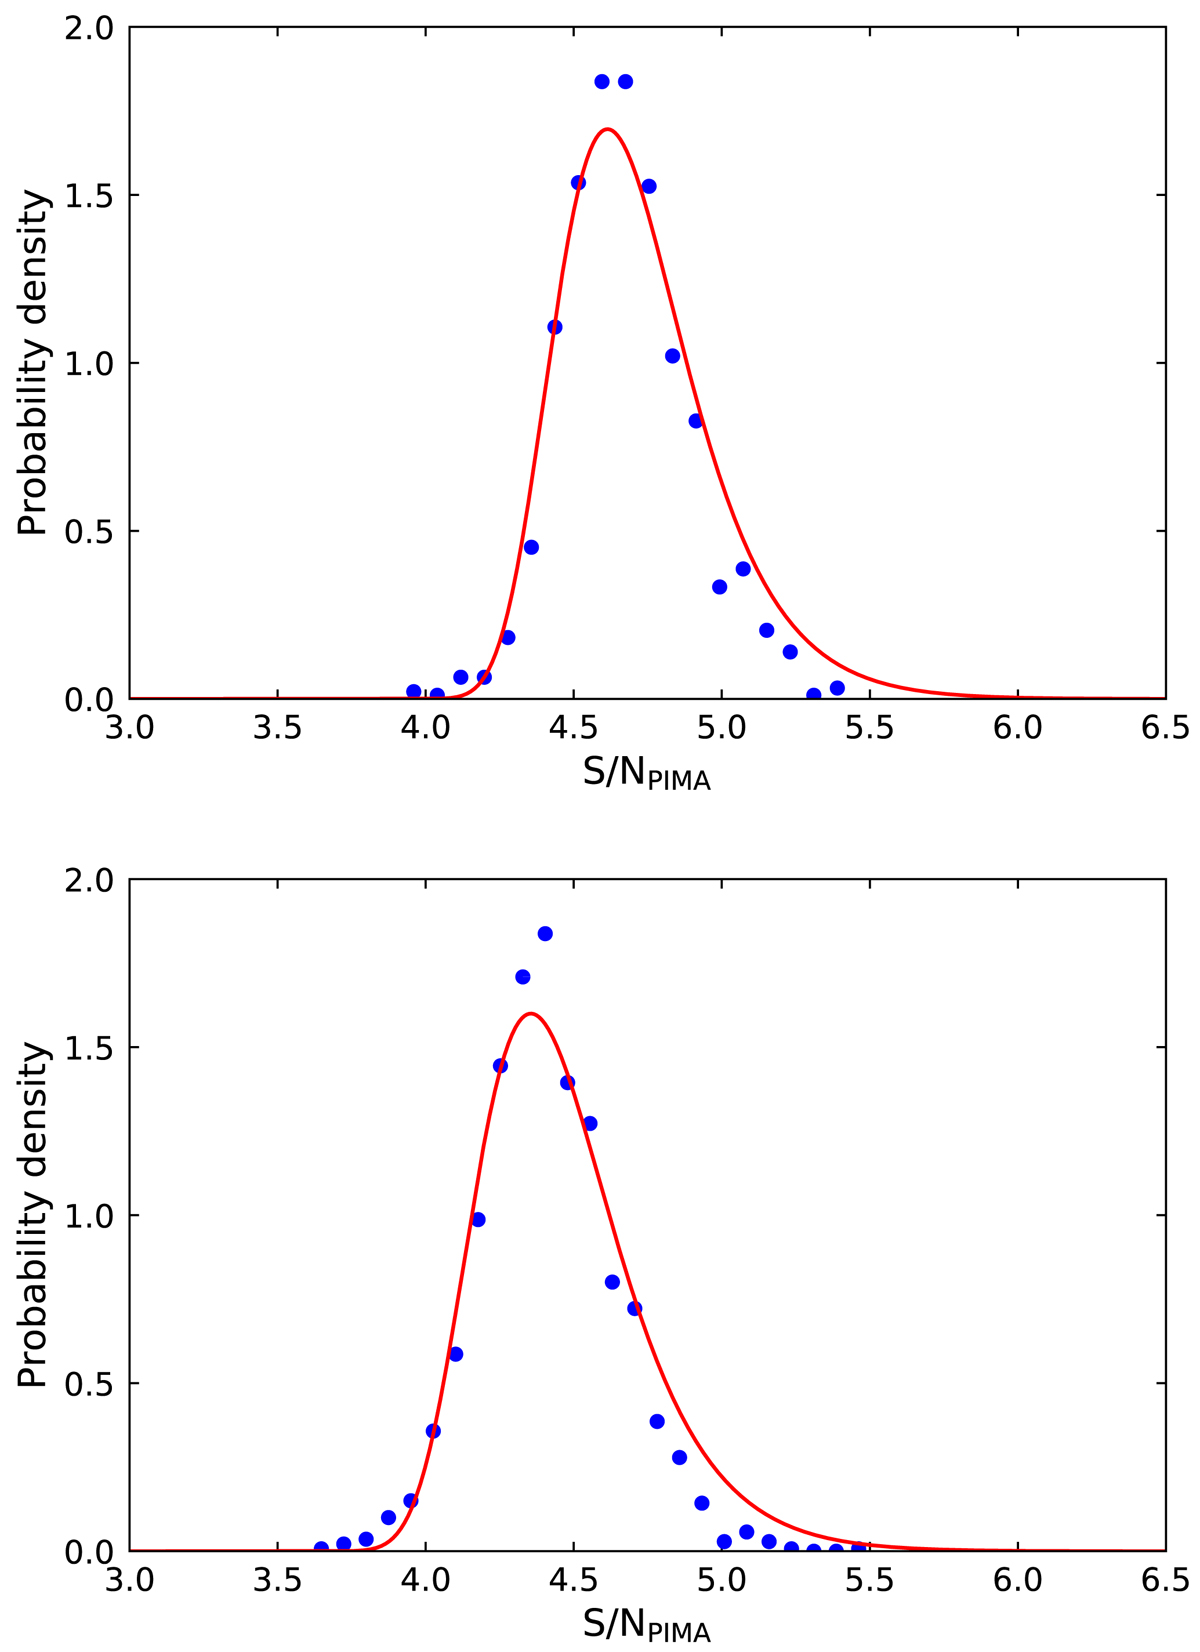
Fig. A.1.
Download original image
Empirical distribution of the maximum S/NPIMA of the fringe amplitude from PIMA fringe-fitting data on the SRT baselines n the C band (top) and K band (bottom) when no signal was present in the chosen search region (blue points). The red curve shows the fitted theoretical probability distribution. The shift in the maximum position is mainly due to the different size of the search space: C band fringe-fitting was carried out first and therefore a larger search space was used than in the K band.
Current usage metrics show cumulative count of Article Views (full-text article views including HTML views, PDF and ePub downloads, according to the available data) and Abstracts Views on Vision4Press platform.
Data correspond to usage on the plateform after 2015. The current usage metrics is available 48-96 hours after online publication and is updated daily on week days.
Initial download of the metrics may take a while.