Fig. 11.
Download original image
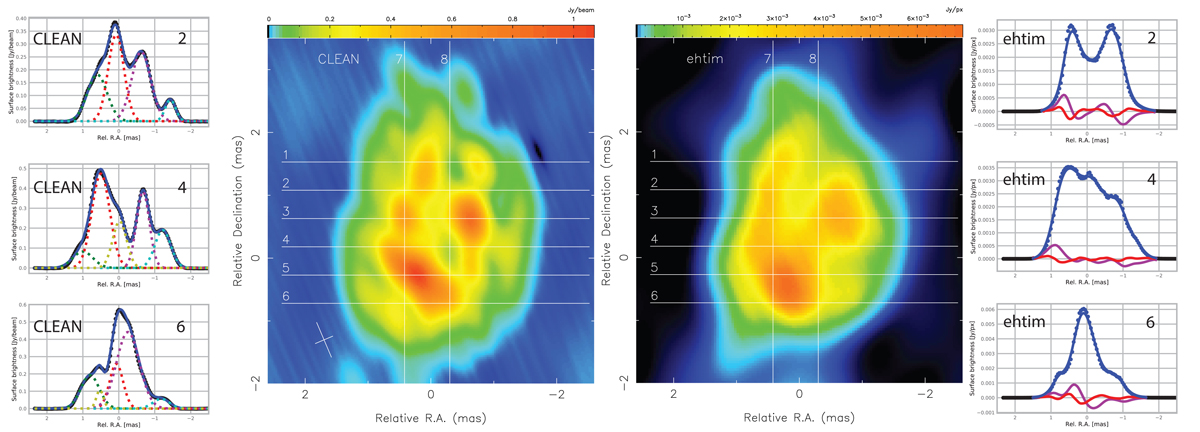
Intensity cross-sections across the core region of 3C 84 at 5 GHz. The second and third panels from the left show the CLEAN image (0.6 × 0.3 mas at 23°) and the EHTIM (MEM = 0, TV = 1, TV2 = 1, L1 = 1; see Appendix C for an explanation of the parameters) image, both in logarithmic colour scale with the analysed cross-sections overlaid. The left panel shows three examples of CLEAN image cross-sections with Gaussian fits. The right panel again shows three examples of EHTIM cross-sections, where the black dots are the pixel intensities, the blue curve is the Gaussian-smoothed intensity cross-section, the magenta curve is the first derivative of the smoothed cross-section, and the red curve is the second derivative of the smoothed cross-section.
Current usage metrics show cumulative count of Article Views (full-text article views including HTML views, PDF and ePub downloads, according to the available data) and Abstracts Views on Vision4Press platform.
Data correspond to usage on the plateform after 2015. The current usage metrics is available 48-96 hours after online publication and is updated daily on week days.
Initial download of the metrics may take a while.