Fig. 8
Download original image
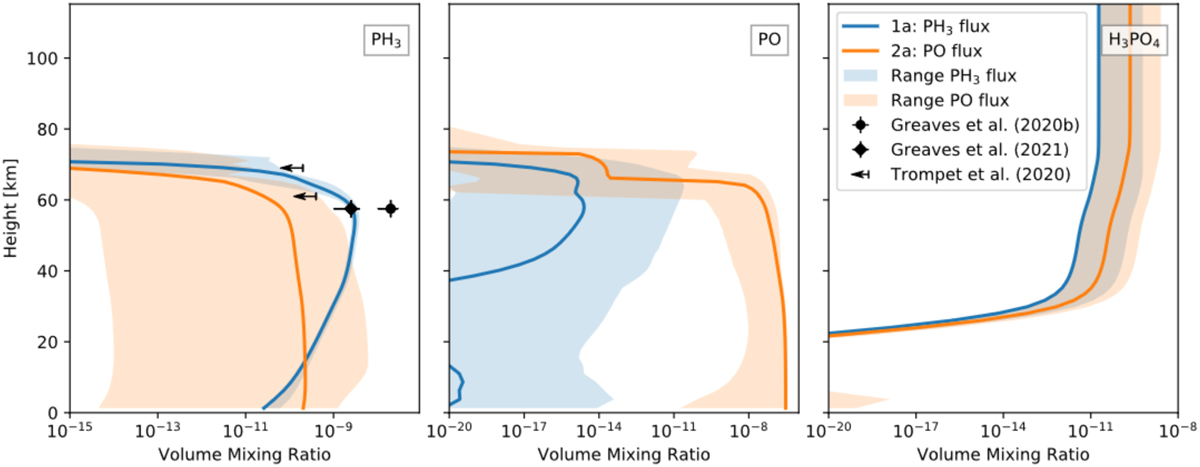
Venus composition profiles for selected species predicted with our photochemistry model for scenario 1 (PH3 flux, solid blue line) and scenario 2 (PO flux, solid orange line). The shaded areas show the 99% ranges of the MC runs of scenario 1 (shaded blue) and scenario 2 (shaded orange). For comparison, a range of observations is shown with black lines. We additionally show the observational ranges from Greaves et al. (2020, 2021b) and upper limits of Trompet et al. (2021).
Current usage metrics show cumulative count of Article Views (full-text article views including HTML views, PDF and ePub downloads, according to the available data) and Abstracts Views on Vision4Press platform.
Data correspond to usage on the plateform after 2015. The current usage metrics is available 48-96 hours after online publication and is updated daily on week days.
Initial download of the metrics may take a while.