Fig. 5
Download original image
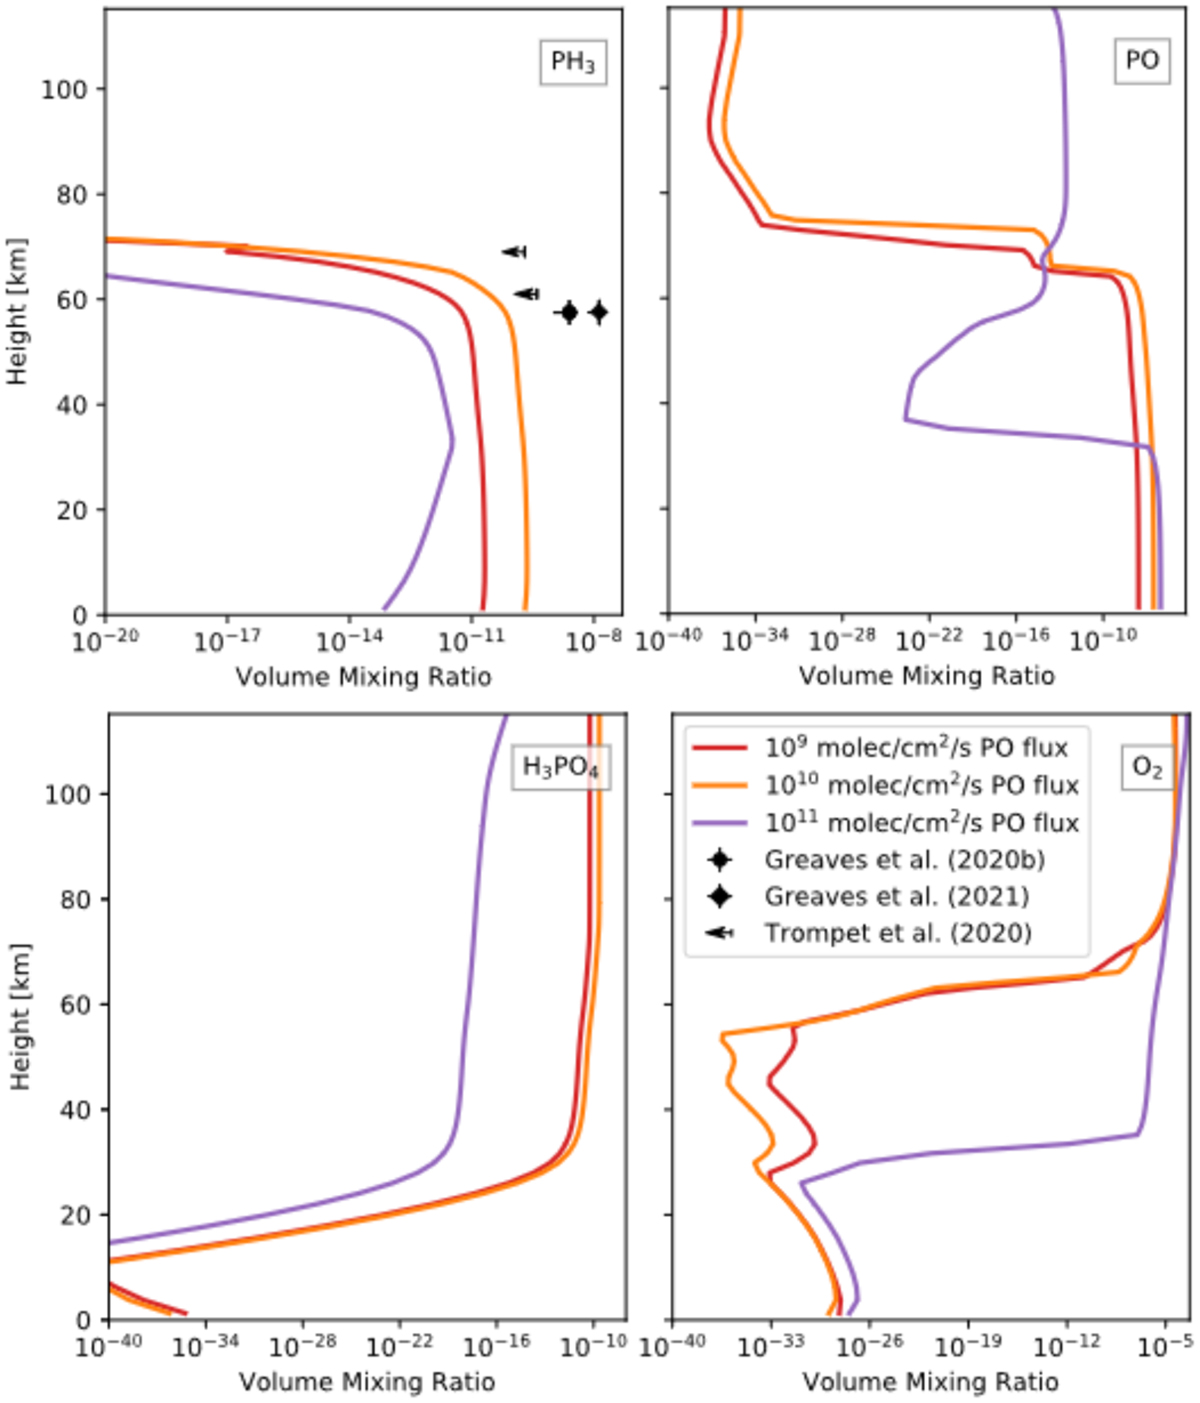
Predicted volume mixing ratios of PH3, PO, H3PO4, and O2 against height for scenario 2a with three different PO input fluxes: 1 × 10⁹ molecules cm−2 s−1 (red line), 1 × 10¹⁰ molecules cm−2 s−1 (orange line), and 1 × 10¹¹ molecules cm−2 s−1 (purple line). We additionally show the observational ranges from Greaves et al. (2020, 2021b) and upper limits of Trompet et al. (2021).
Current usage metrics show cumulative count of Article Views (full-text article views including HTML views, PDF and ePub downloads, according to the available data) and Abstracts Views on Vision4Press platform.
Data correspond to usage on the plateform after 2015. The current usage metrics is available 48-96 hours after online publication and is updated daily on week days.
Initial download of the metrics may take a while.