Fig. 4
Download original image
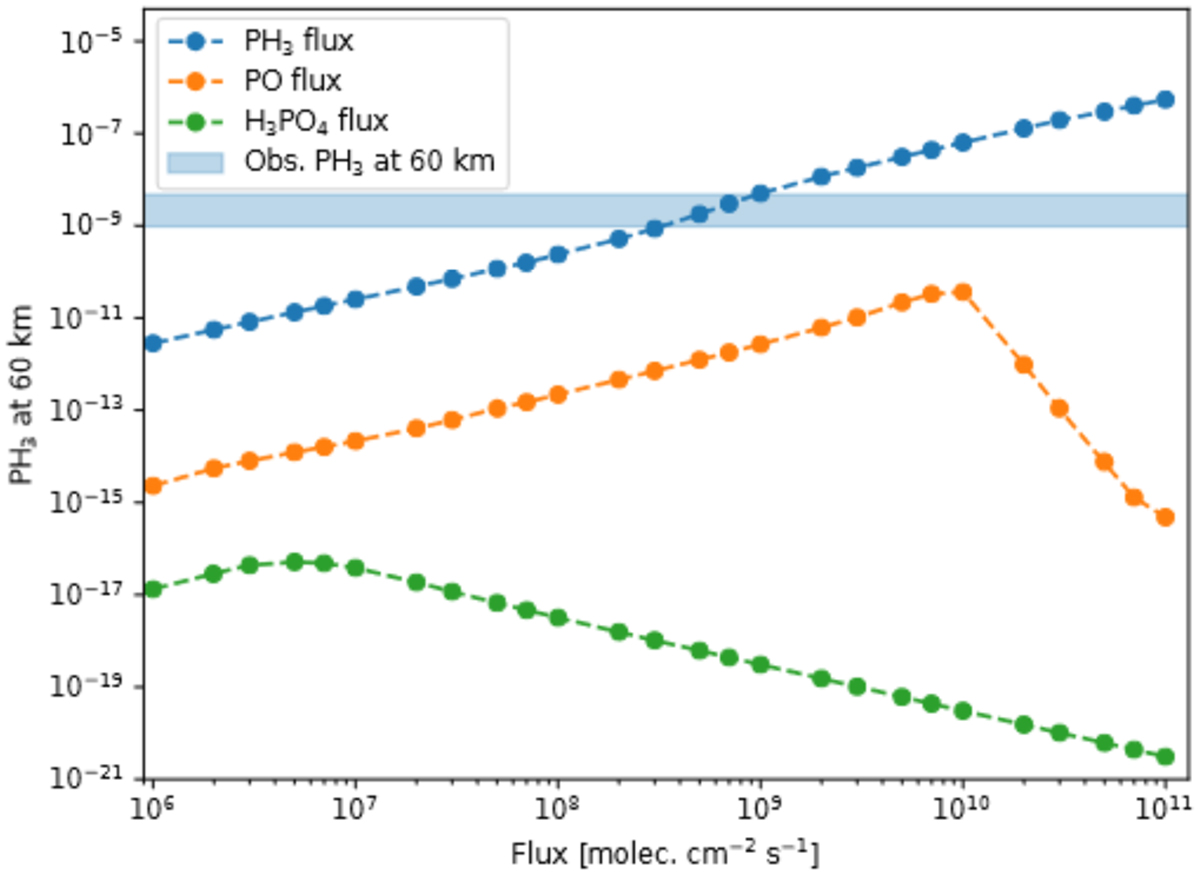
Concentrations of PH3 at 60 km for scenario 1a (blue dots and dashed line), scenario 2a (orange dots and dashed line), and scenario 3 (green dots and dashed line) with increasing input fluxes of PH3 between 50 and 60 km, PO below 25 km, and H3PO4 between 50 and 60 km, respectively. The observational range of PH3 is taken from Greaves et al. (2020).
Current usage metrics show cumulative count of Article Views (full-text article views including HTML views, PDF and ePub downloads, according to the available data) and Abstracts Views on Vision4Press platform.
Data correspond to usage on the plateform after 2015. The current usage metrics is available 48-96 hours after online publication and is updated daily on week days.
Initial download of the metrics may take a while.