Fig. 8
Download original image
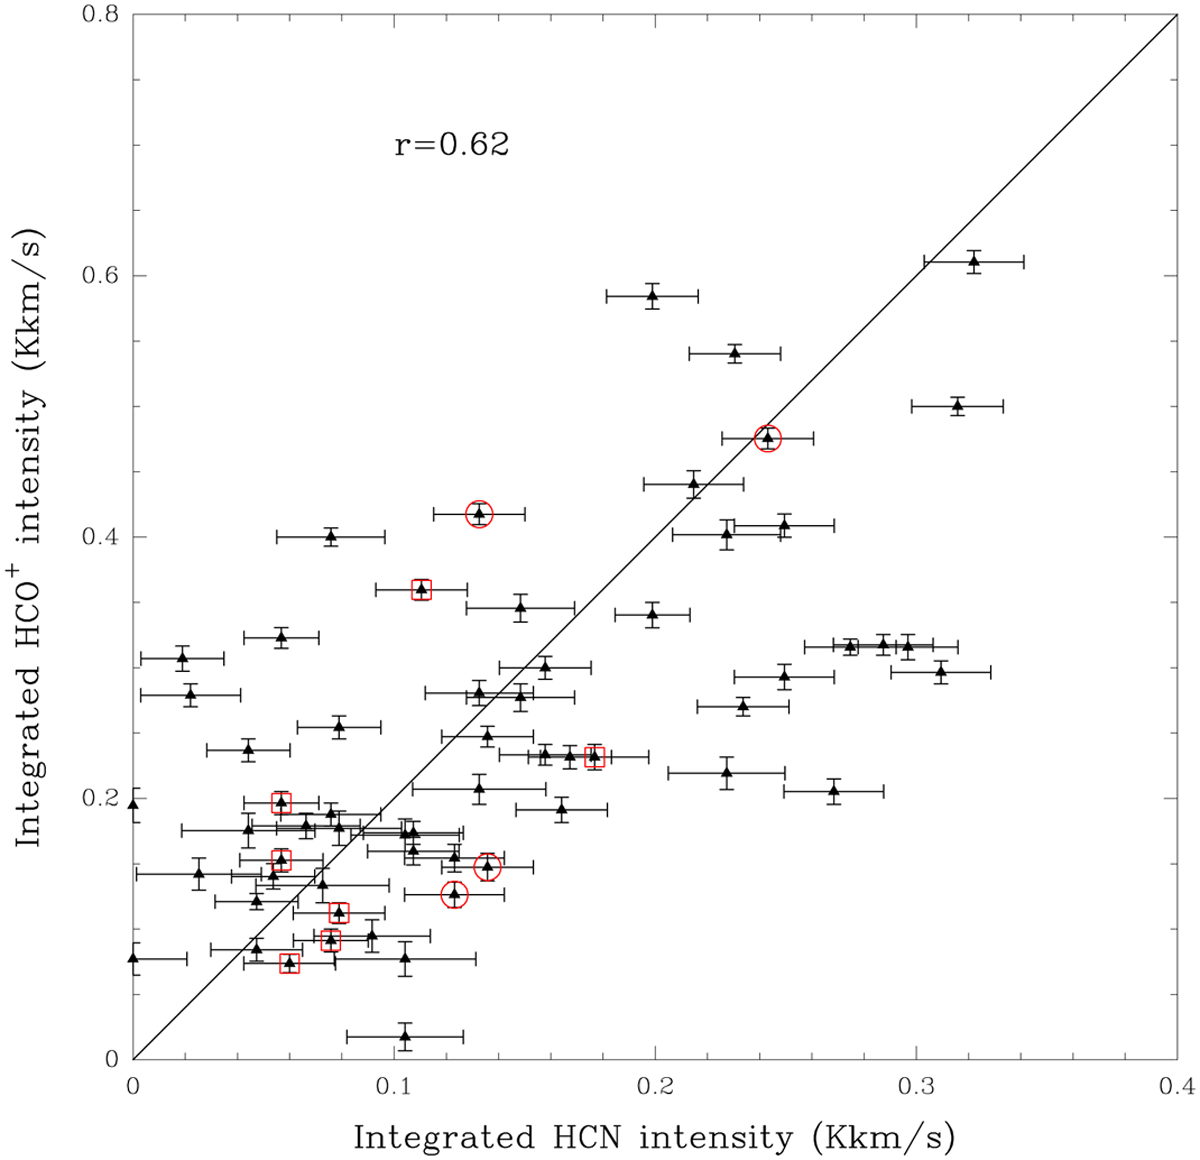
Integrated intensities of HCN and HCO+ lines for all positions observed. All data are on the main beam temperature scale and the central HCN intensity has been multiplied by 9/5 to account for the satellite hyperfine components. The line indicates ![]() , close to the best-fit value of 1.92. Class I and II sources are indicated by respectively red circles and squares.
, close to the best-fit value of 1.92. Class I and II sources are indicated by respectively red circles and squares.
Current usage metrics show cumulative count of Article Views (full-text article views including HTML views, PDF and ePub downloads, according to the available data) and Abstracts Views on Vision4Press platform.
Data correspond to usage on the plateform after 2015. The current usage metrics is available 48-96 hours after online publication and is updated daily on week days.
Initial download of the metrics may take a while.