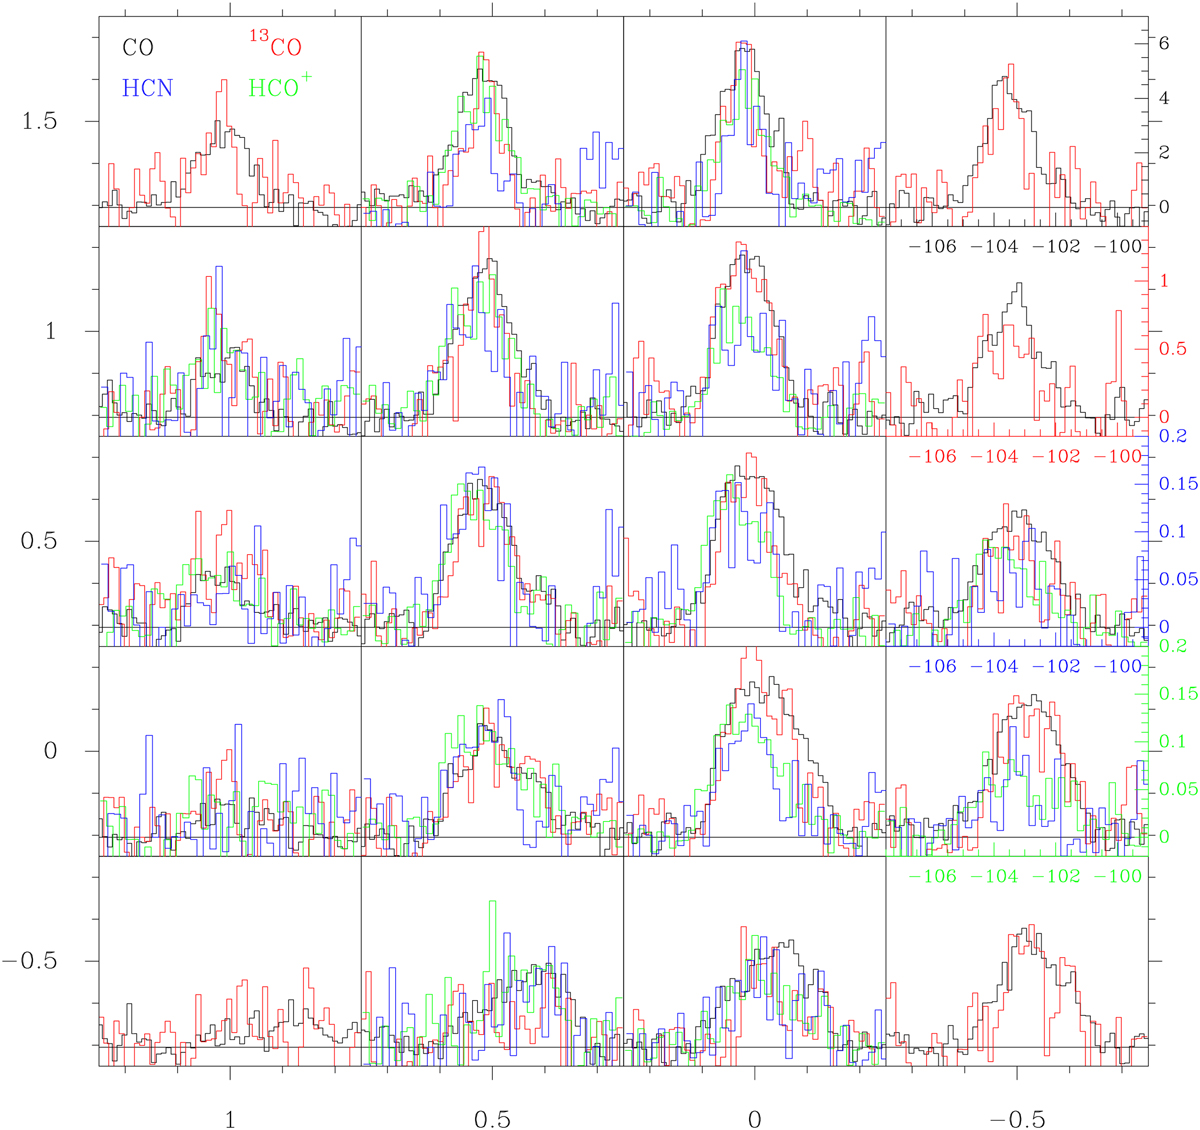
Fig. 5
Download original image
Spectra of Cloud 56. Positions are indicated on the x and y axes as offsets in arcminutes and each box represents 30″. 12CO is in black, 13CO in red, HCO+ in green and HCN in blue. The velocity scale goes from −107.5 km s−1 to −99 km s−1. The temperatures scales are −.7 to 7K for 12CO, −.14 to 1.4K for 13CO, −.02 to .2 for HCO+ and for HCN. The HCN line (only central component shown) has been multiplied by 9/5 so that the line intensity represents the total line flux for comparison with other species. The spectra in the corners show only CO as not all positions were observed in HCN and HCO+.
Current usage metrics show cumulative count of Article Views (full-text article views including HTML views, PDF and ePub downloads, according to the available data) and Abstracts Views on Vision4Press platform.
Data correspond to usage on the plateform after 2015. The current usage metrics is available 48-96 hours after online publication and is updated daily on week days.
Initial download of the metrics may take a while.