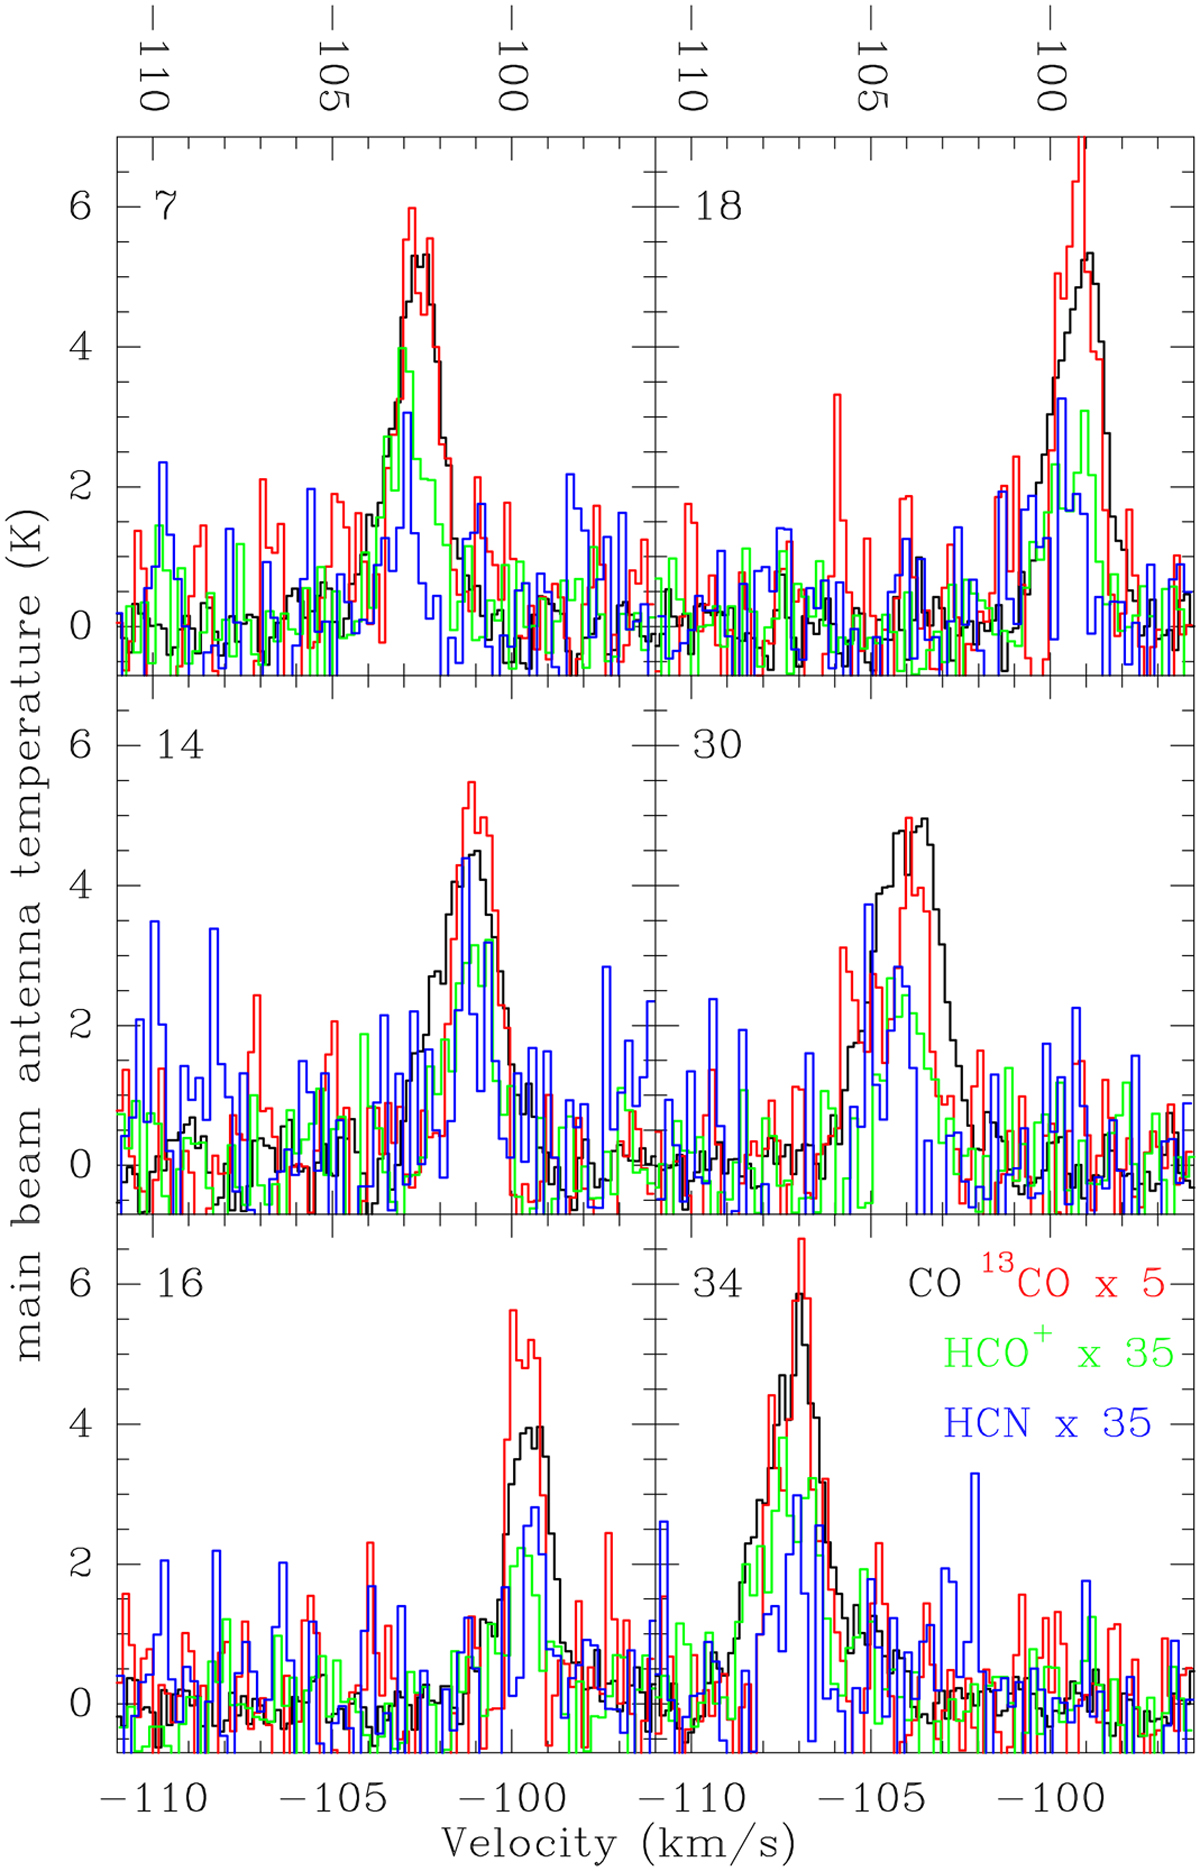
Fig. 3
Download original image
Spectra for the clouds that have not been mapped, as in Fig. 1. The axes are the same for each cloud. 12CO is in black and corresponds to the temperature scale. 13CO is in red and has been multiplied by 5. HCO+, in green, has been multiplied by 35. The HCN spectra have been multiplied by 35 for comparison with HCO+ but also multiplied by 9/5 to account for the satellite lines as explained in the text. The 12CO and 13CO spectra have been convolved with a Gaussian kernel to the angular resolution of the HCN and HCO+ spectra.
Current usage metrics show cumulative count of Article Views (full-text article views including HTML views, PDF and ePub downloads, according to the available data) and Abstracts Views on Vision4Press platform.
Data correspond to usage on the plateform after 2015. The current usage metrics is available 48-96 hours after online publication and is updated daily on week days.
Initial download of the metrics may take a while.