Fig. 2
Download original image
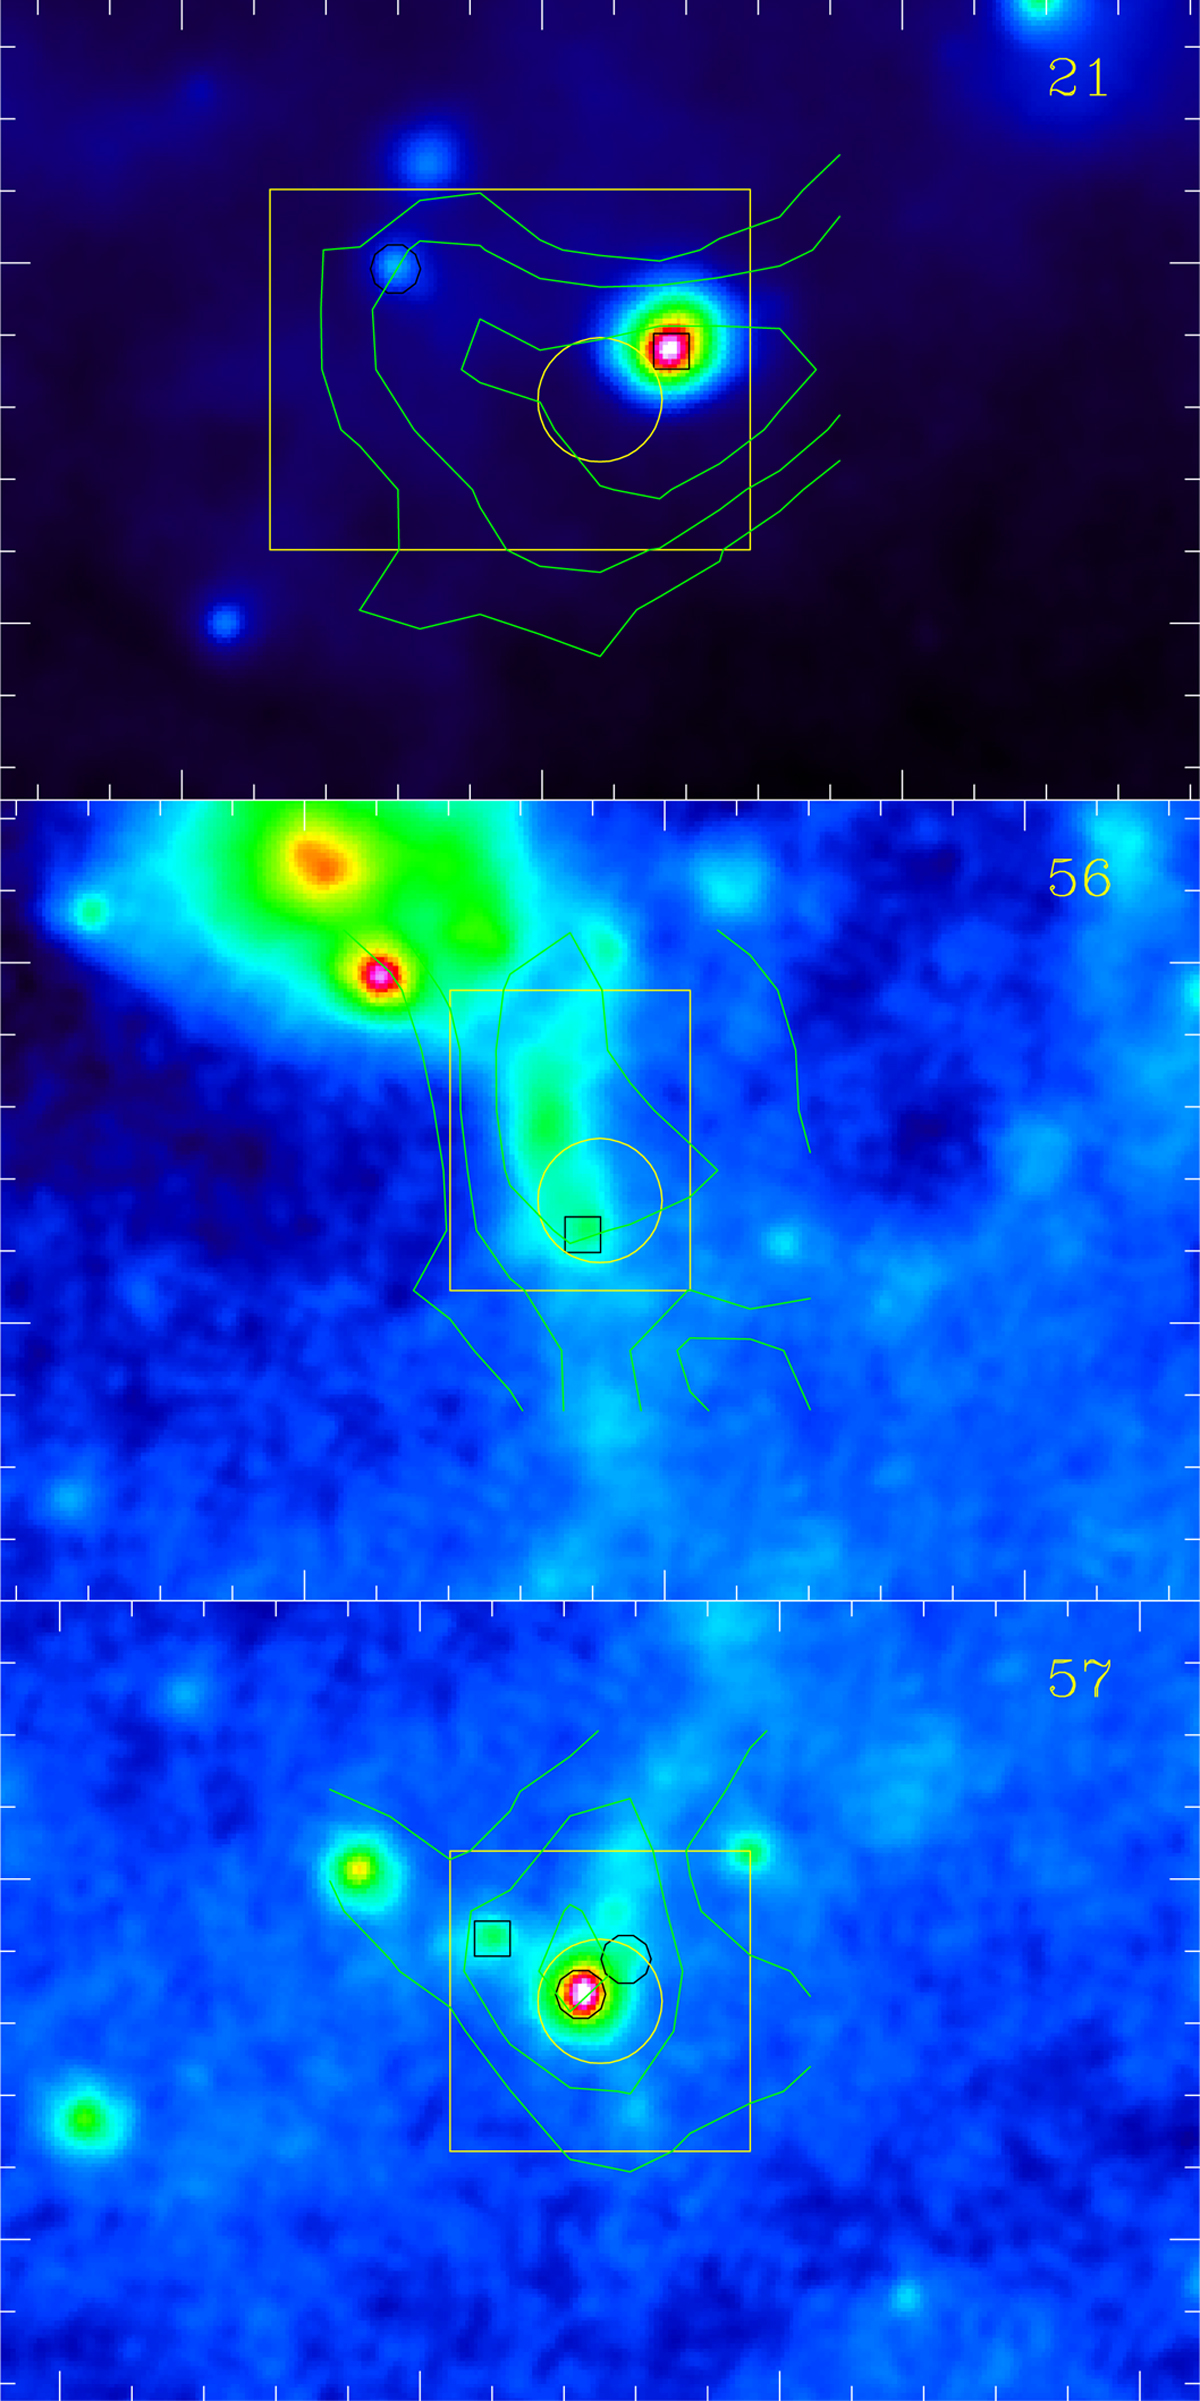
WISE 22 μm band images of sources 21, 56, and 57 (identification in upper right corner). These are the sources which were mapped. The images are all 600″ × 400″ in size, oriented in l and b. The color scale (rainbow from black to white) of the WISE observations differs from image to image. For cloud 21 it is from 95 to 116 and for clouds 56 and 57 the range is from 129 to 134 counts. The central circle gives the HCN/HCO+ beamsize and is the (0,0) position in Figs. 4–6 which show the spectra. The box indicates the size of the region shown in Figs. 4–6. Following Sun (2015), class I sources within our maps are shown as circles and class II as squares.
Current usage metrics show cumulative count of Article Views (full-text article views including HTML views, PDF and ePub downloads, according to the available data) and Abstracts Views on Vision4Press platform.
Data correspond to usage on the plateform after 2015. The current usage metrics is available 48-96 hours after online publication and is updated daily on week days.
Initial download of the metrics may take a while.