Fig. 14
Download original image
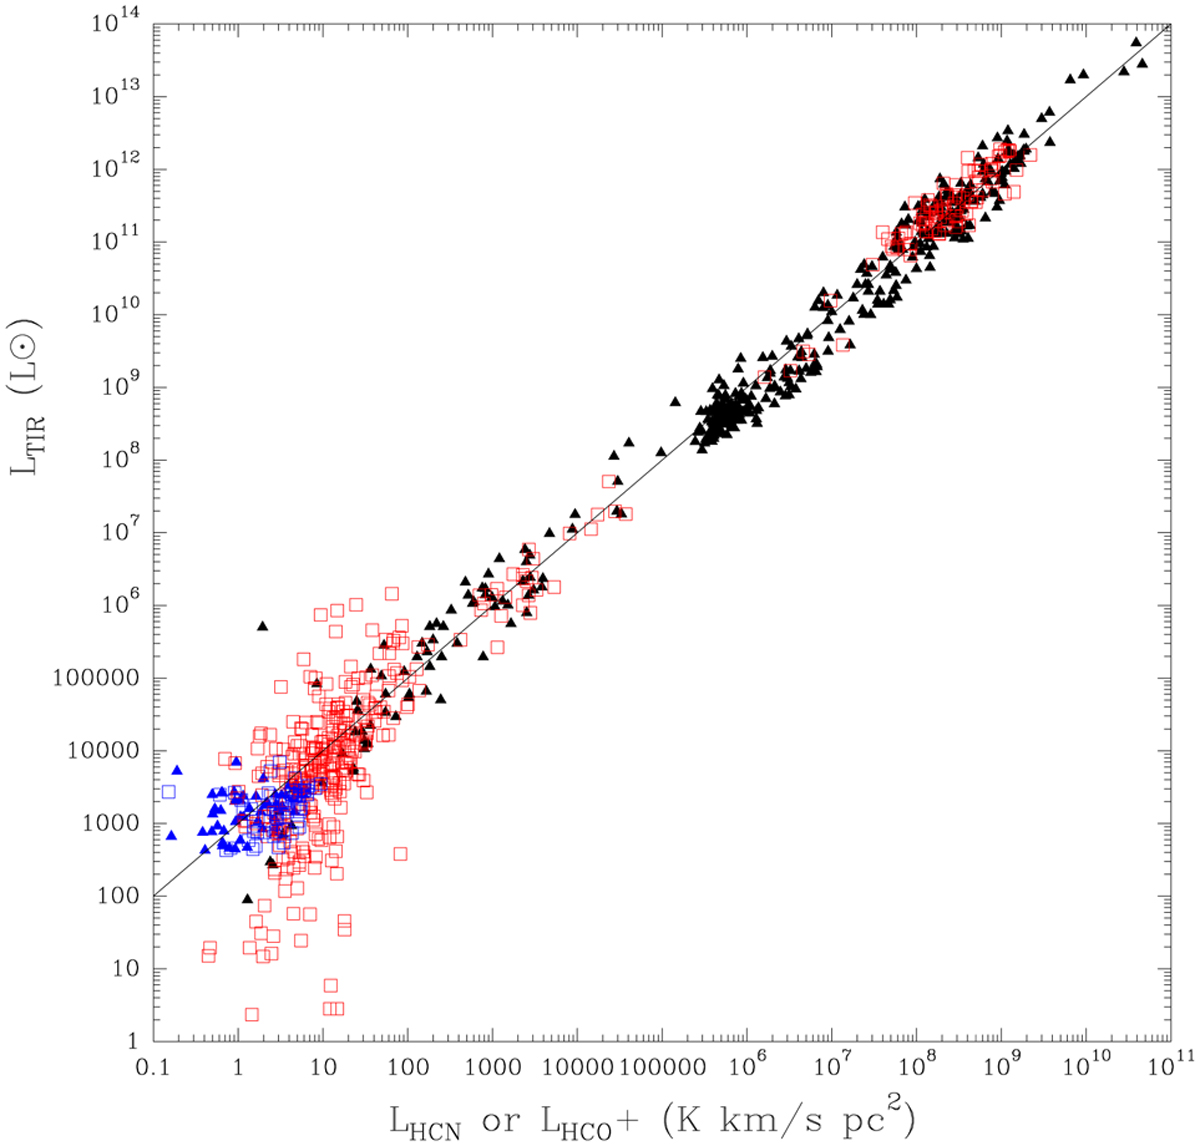
Link between dense gas mass (HCN or HCO+ luminosity on the x-axis) and SF rate (IR luminosity on the y-axis). The line shows a linear relation with ![]() . HCN data are shown as filled triangles and HCO+ as open squares. The outer disk data presented in this paper are shown in blue. The sources for the data are: Chin et al. (1997, 1998), Gao & Solomon (2004b), Gao et al. (2007), Brouillet et al. (2005), Wu et al. (2005), Ma et al. (2013), Buchbender (2014), Krips et al. (2008), Juneau et al. (2009), Privon et al. (2015), Graciá-Carpio et al. (2008), García-Burillo et al. (2012), Chen et al. (2015, 2017), Usero et al. (2015).
. HCN data are shown as filled triangles and HCO+ as open squares. The outer disk data presented in this paper are shown in blue. The sources for the data are: Chin et al. (1997, 1998), Gao & Solomon (2004b), Gao et al. (2007), Brouillet et al. (2005), Wu et al. (2005), Ma et al. (2013), Buchbender (2014), Krips et al. (2008), Juneau et al. (2009), Privon et al. (2015), Graciá-Carpio et al. (2008), García-Burillo et al. (2012), Chen et al. (2015, 2017), Usero et al. (2015).
Current usage metrics show cumulative count of Article Views (full-text article views including HTML views, PDF and ePub downloads, according to the available data) and Abstracts Views on Vision4Press platform.
Data correspond to usage on the plateform after 2015. The current usage metrics is available 48-96 hours after online publication and is updated daily on week days.
Initial download of the metrics may take a while.