Fig. 13
Download original image
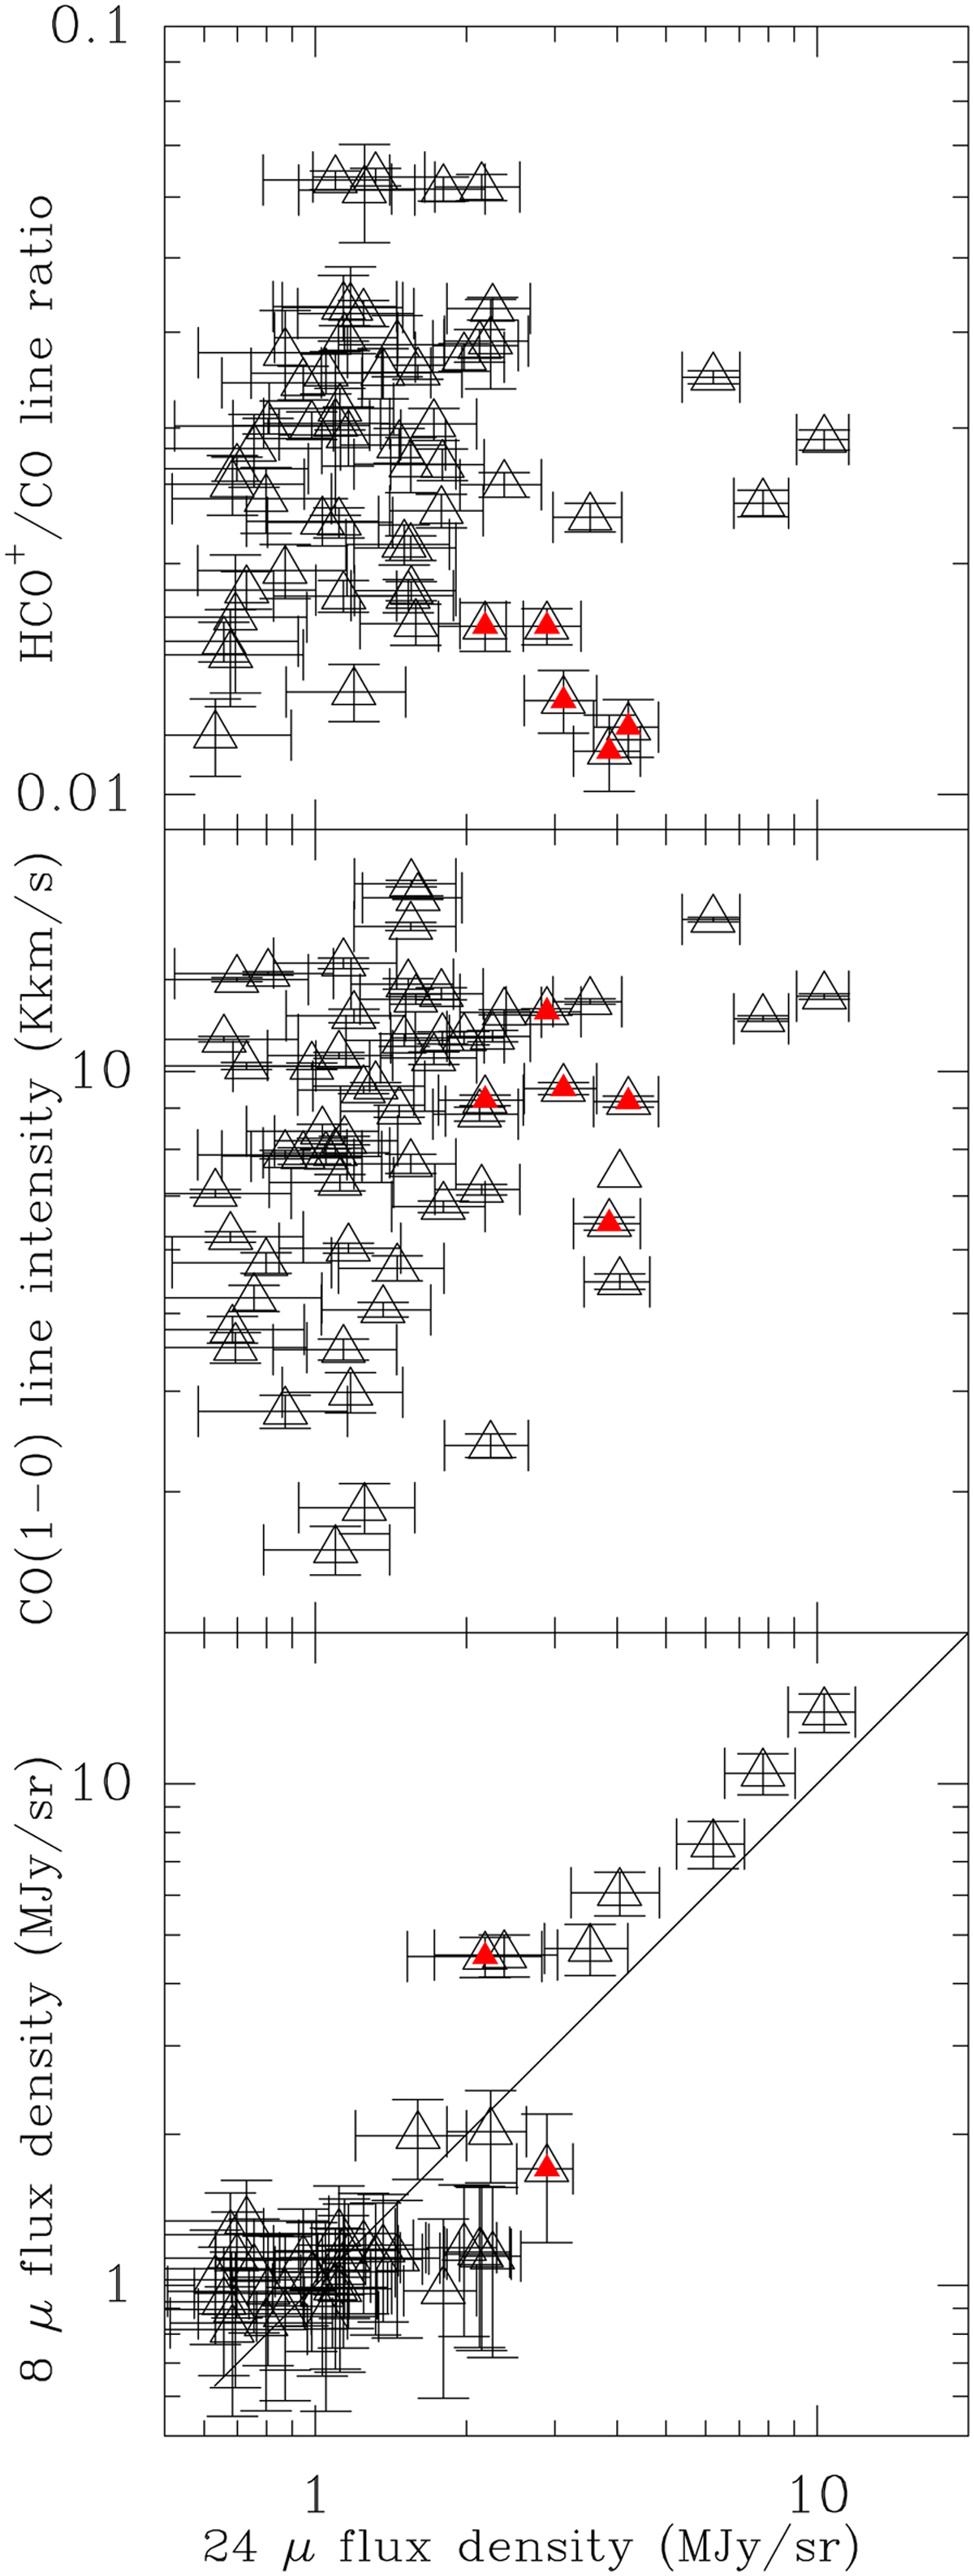
Comparison of molecular line intensities and tracers of SF. The bottom panel compares the SFR tracers: background-subtracted 24 μm emission and 8 μm emission, also background-subtracted (the background emission is considerably stronger than any stellar contribution at 8 μm). The middle panel shows how the 12CO intensity varies with SFR. The top panel shows how the dense gas fraction, as traced by the HCO+/CO ratio, varies with SFR. The red triangles indicate the sources which are at high Galactic latitude. It should be immediately apparent that these sources are not distinguishable from the others in the lower two frames but occupy a specific region with low dense gas fraction in the top panel. Neither 8 nor 24 μm data are available for cloud 30.
Current usage metrics show cumulative count of Article Views (full-text article views including HTML views, PDF and ePub downloads, according to the available data) and Abstracts Views on Vision4Press platform.
Data correspond to usage on the plateform after 2015. The current usage metrics is available 48-96 hours after online publication and is updated daily on week days.
Initial download of the metrics may take a while.