Fig. 11
Download original image
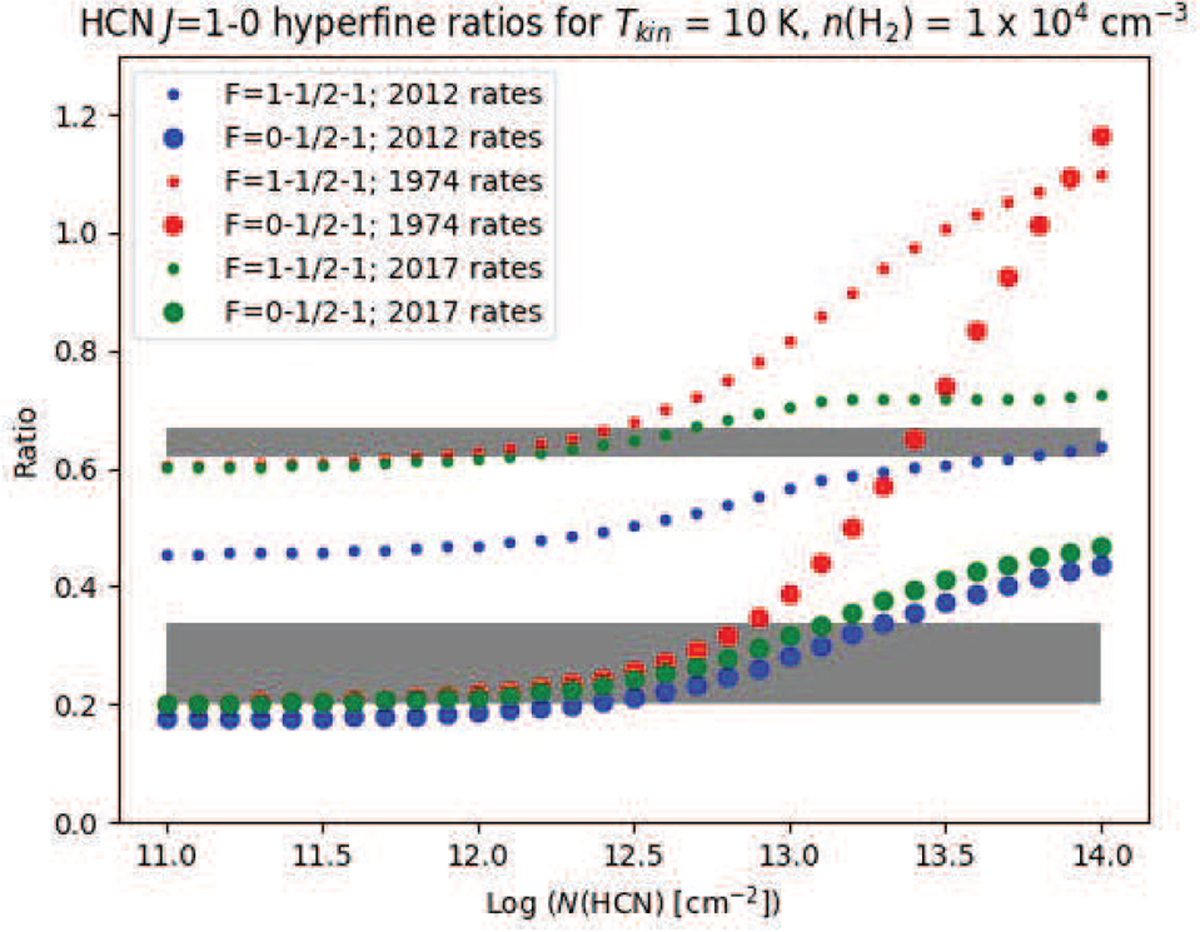
Intensity ratios of the hyperfine components of the HCN J = 1−0 line, calculated with RADEX as a function of N(HCN). Gray areas indicate observed ranges for the F = 1−1/2−1 (top) and 0−1/2−1 (bottom) ratios, respectively 0.6, 0.6, 0.7 and 0.2, 0.2, 0.3 for clouds 21, 56, and 57. The numbers indicating the rates refer to the years of publication of the rates.
Current usage metrics show cumulative count of Article Views (full-text article views including HTML views, PDF and ePub downloads, according to the available data) and Abstracts Views on Vision4Press platform.
Data correspond to usage on the plateform after 2015. The current usage metrics is available 48-96 hours after online publication and is updated daily on week days.
Initial download of the metrics may take a while.