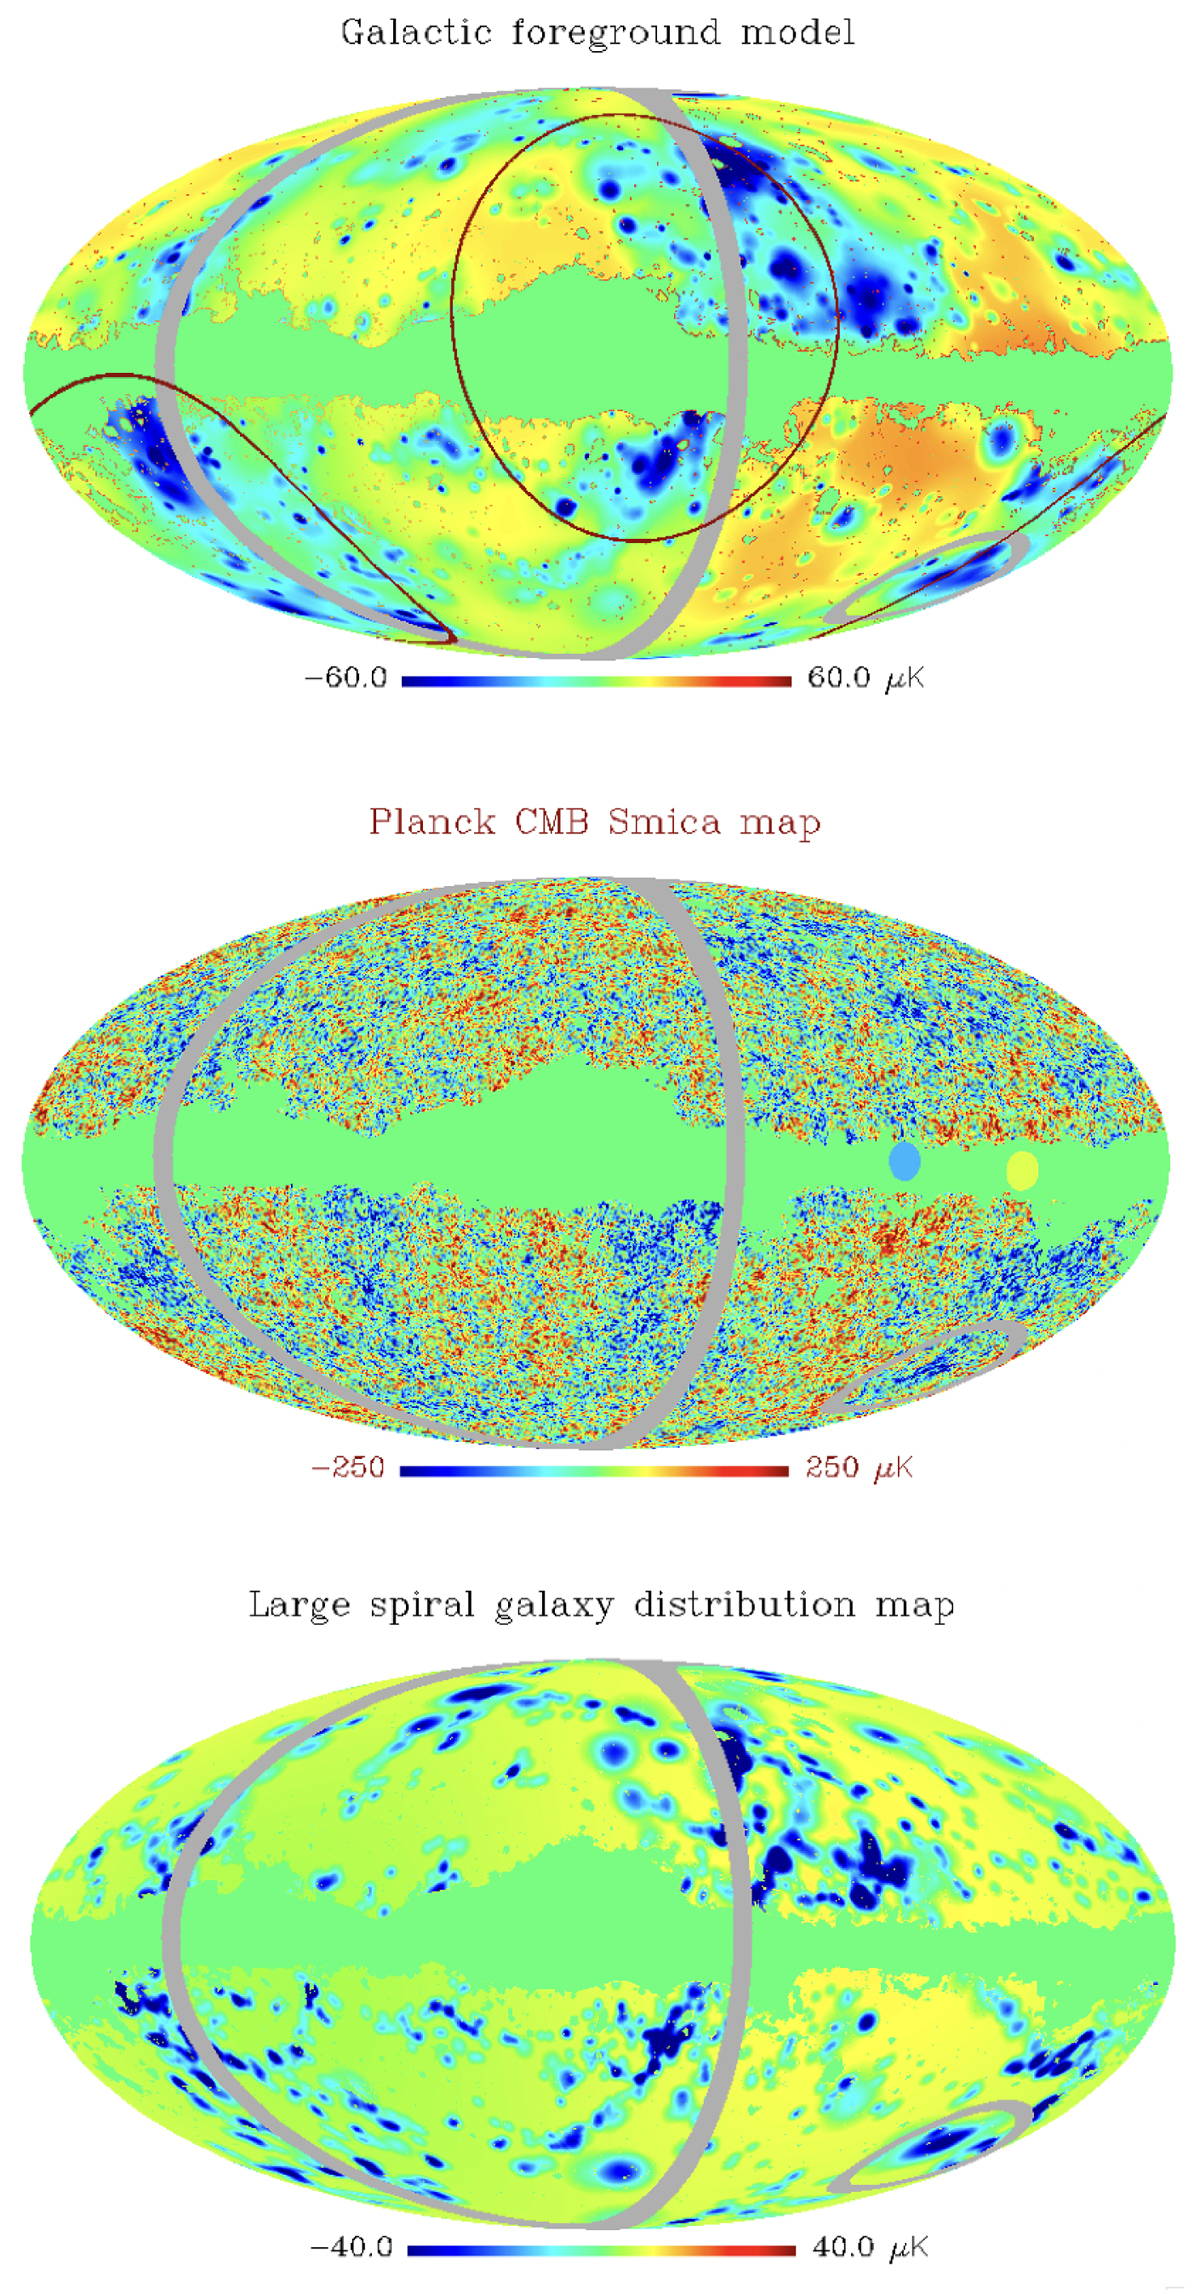
Fig. 2.
Download original image
CMB and modelled foreground maps. Top: Foreground model map in μK. This map was generated by assigning a temperature profile to nearby galaxies (z < 0.02). The decrement profile was found by making some general assumptions about the L2023 foreground and fitting the mean profile to observations. The two red circles show the parameter ‘horizons’ H1 and H3 from Fosalba & Gaztañaga (2021). Middle: Planck SMICA CMB map. Bottom: Simplified foreground model in which all spiral galaxies > 8.5 kpc have been assigned the same profile independently of their size and environment. This is therefore also a density map of nearby spiral galaxies on the sky. In all maps, the grey circle in the lower-right corner shows the position of the cold spot. The maps are divided into two hemispheres, the hemispheres of maximum and minimum power in the multipoles range ℓ = 2 − 220 obtained from the CMB. In the top CMB map, the blue disc indicates the hemisphere with more power in the foreground map, whereas the yellow disc indicates the centre of the hemisphere with more power in the CMB.
Current usage metrics show cumulative count of Article Views (full-text article views including HTML views, PDF and ePub downloads, according to the available data) and Abstracts Views on Vision4Press platform.
Data correspond to usage on the plateform after 2015. The current usage metrics is available 48-96 hours after online publication and is updated daily on week days.
Initial download of the metrics may take a while.