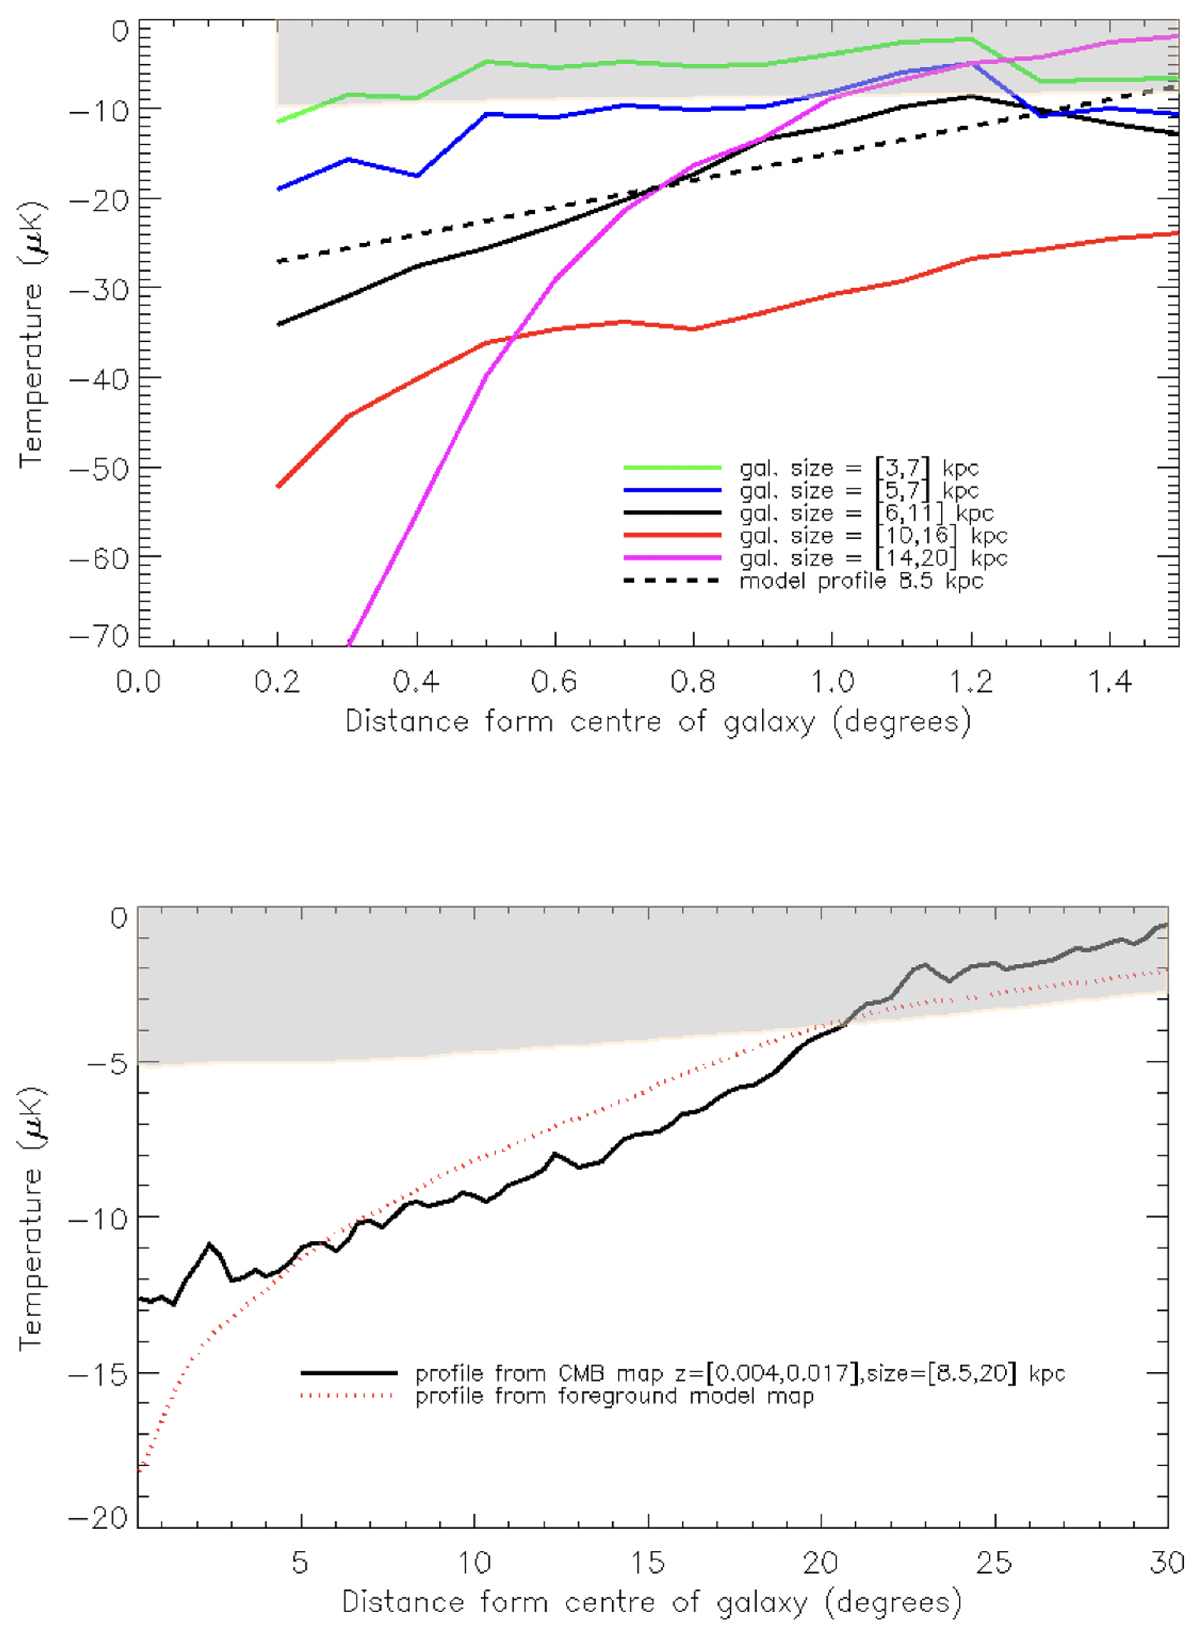
Fig. 1.
Download original image
Temperature profiles around 2MRS galaxies. Upper plot: Examples of mean profiles for a subset of isolated late-type spiral galaxies with different size ranges at z ∼ 0.01. The numbers of galaxies in these samples are ∼10 and ∼50 for the smallest and largest sample sizes, respectively. The dashed line shows the model profile that we assign to galaxies of size 8.5 kpc. The grey band shows the 1σ spread of the profiles for simulated CMB maps taken at the position of the galaxies with sizes [6,11] kpc. Lower plot: Mean profile taken over spiral galaxies within the redshift range z = [0.004, 0.017] and the size range [8.5, 20] kpc for both curves. Shown are the observed data (solid line) and the foreground model created with galaxies in the redshift range [0.004, 0.02] (dotted red line). The grey band shows the 1σ spread of the profile for simulated CMB maps at the same position as the galaxies.
Current usage metrics show cumulative count of Article Views (full-text article views including HTML views, PDF and ePub downloads, according to the available data) and Abstracts Views on Vision4Press platform.
Data correspond to usage on the plateform after 2015. The current usage metrics is available 48-96 hours after online publication and is updated daily on week days.
Initial download of the metrics may take a while.