Open Access
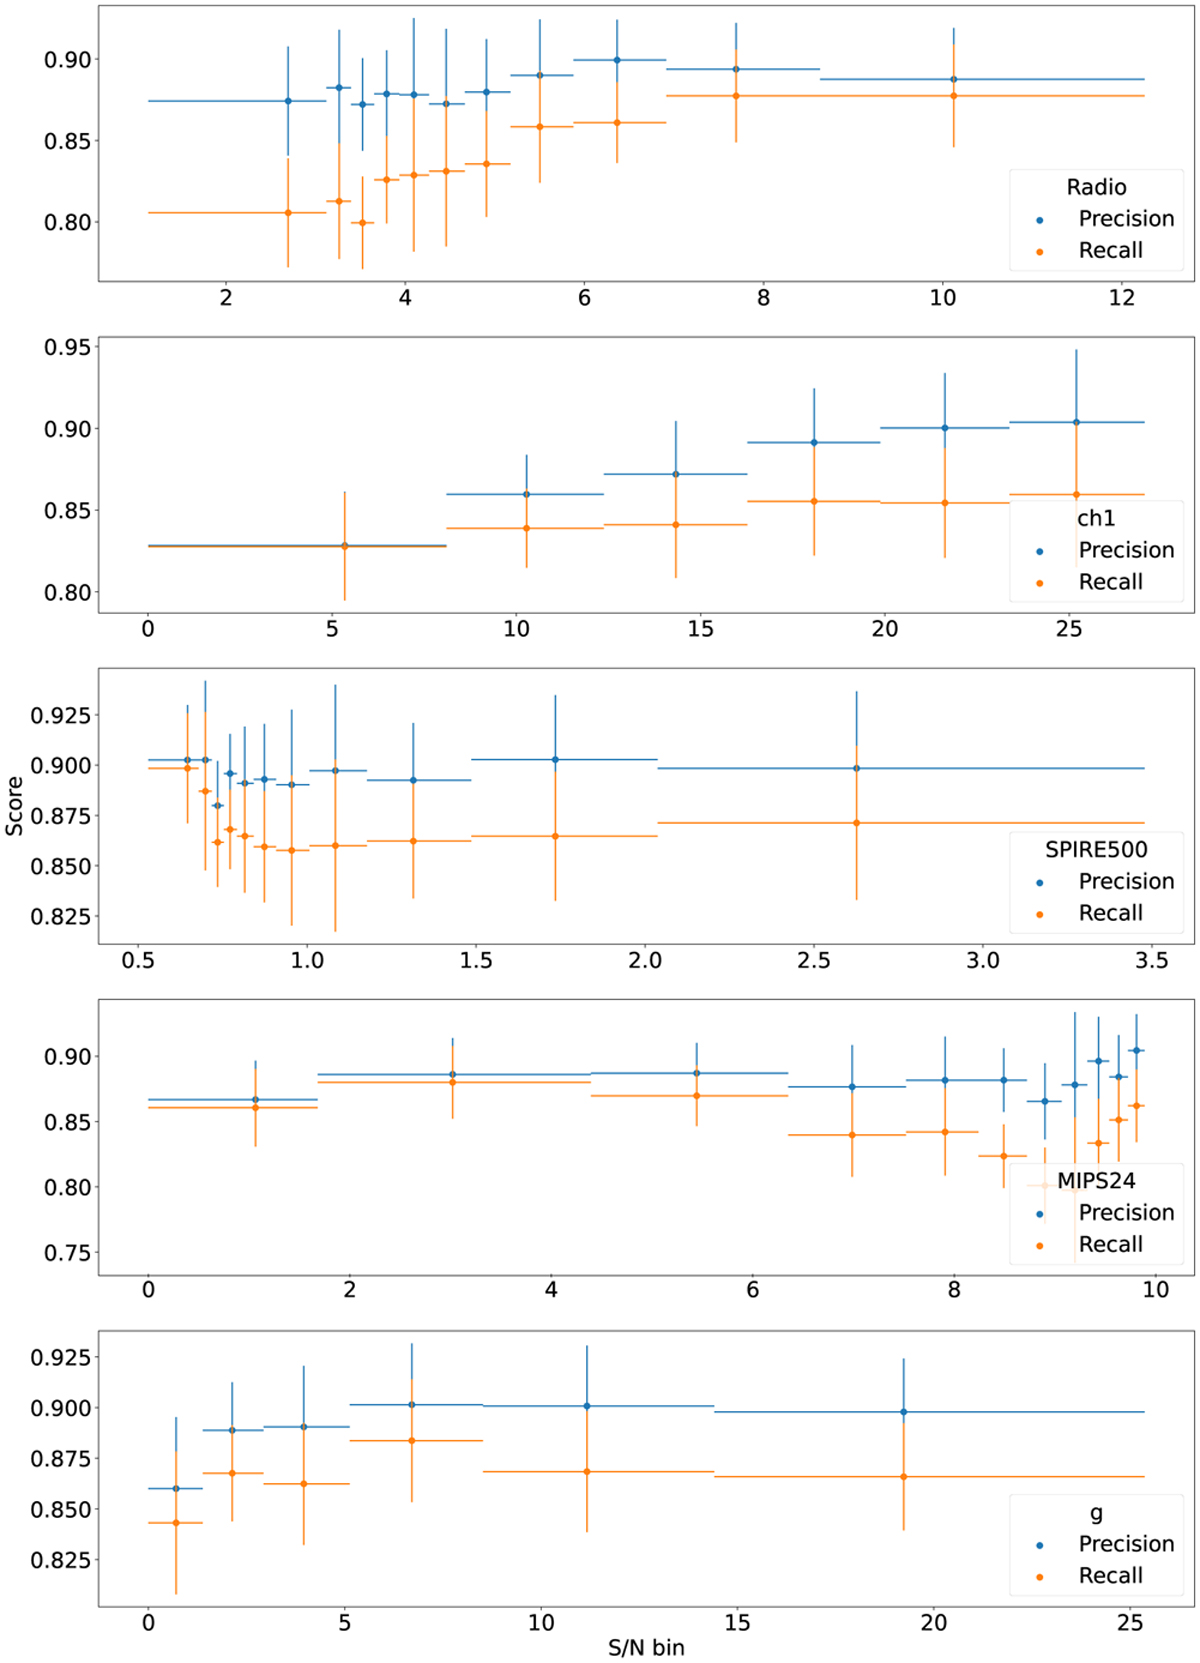
Fig. 7
Download original image
Performance per S/N bin. The x-axis shows the mean value of the S/N bin. The y-axis denotes the macro average precision and recall. The uncertainties in the y-axis are calculated from the 1σ standard deviation over the eight-fold cross-validation. The uncertainty on the x-axis is the bin width.
Current usage metrics show cumulative count of Article Views (full-text article views including HTML views, PDF and ePub downloads, according to the available data) and Abstracts Views on Vision4Press platform.
Data correspond to usage on the plateform after 2015. The current usage metrics is available 48-96 hours after online publication and is updated daily on week days.
Initial download of the metrics may take a while.