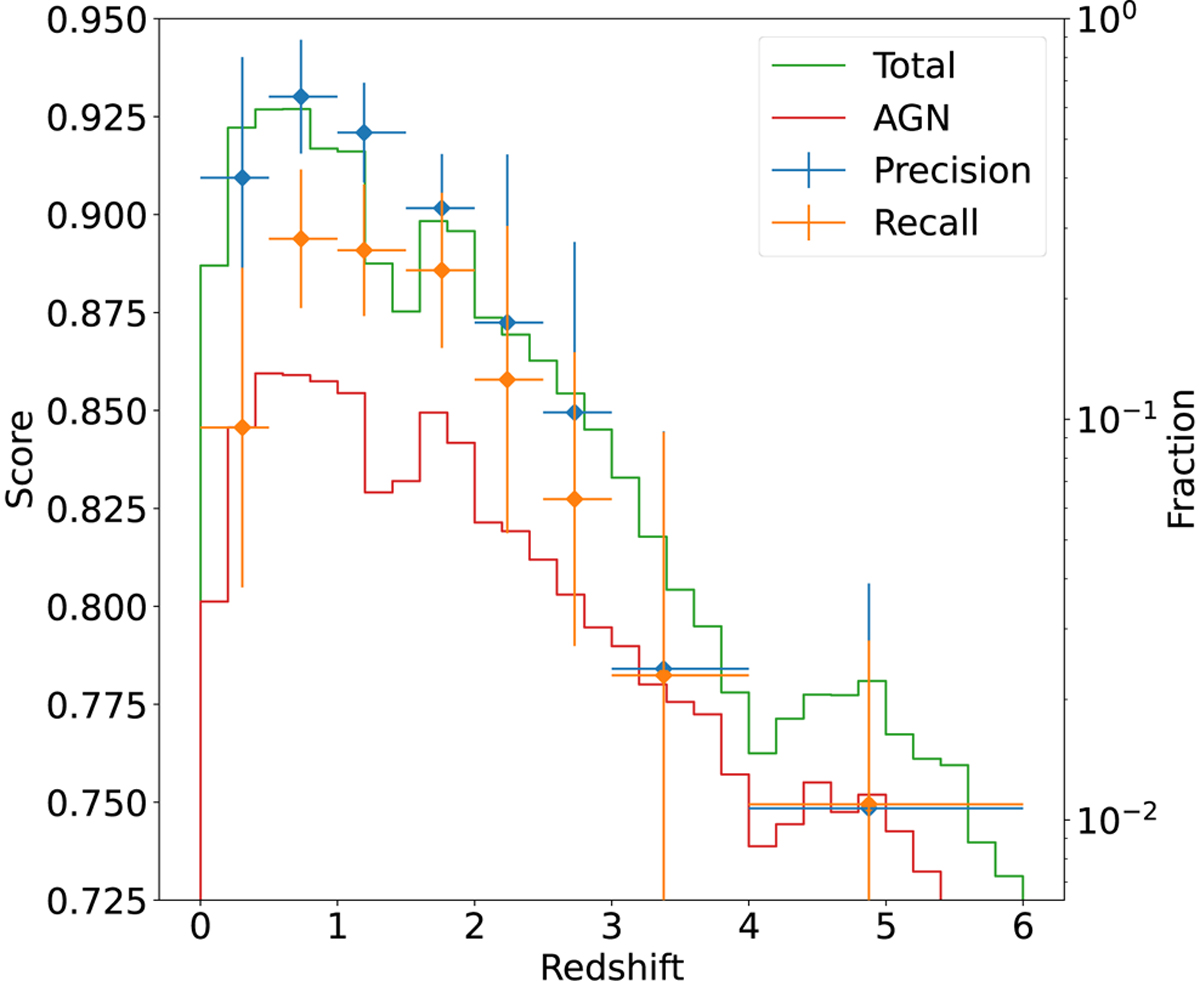
Fig. 6
Download original image
Eight-fold cross-validated results of binned testing sets based on redshift. On the x-axis, we display the redshift. The points and errors are calculated by taking the mean and boundaries of each bin. In addition to the precision and recall on the left y-axis, the fraction of the data contained within the bin is plotted on the right y-axis. The y-errors represent 1σ standard deviations of the scores. The borders of the bins are [0, 0.5, 1, 1.5, 2, 2.5, 3, 4, 6].
Current usage metrics show cumulative count of Article Views (full-text article views including HTML views, PDF and ePub downloads, according to the available data) and Abstracts Views on Vision4Press platform.
Data correspond to usage on the plateform after 2015. The current usage metrics is available 48-96 hours after online publication and is updated daily on week days.
Initial download of the metrics may take a while.