Fig. 5
Download original image
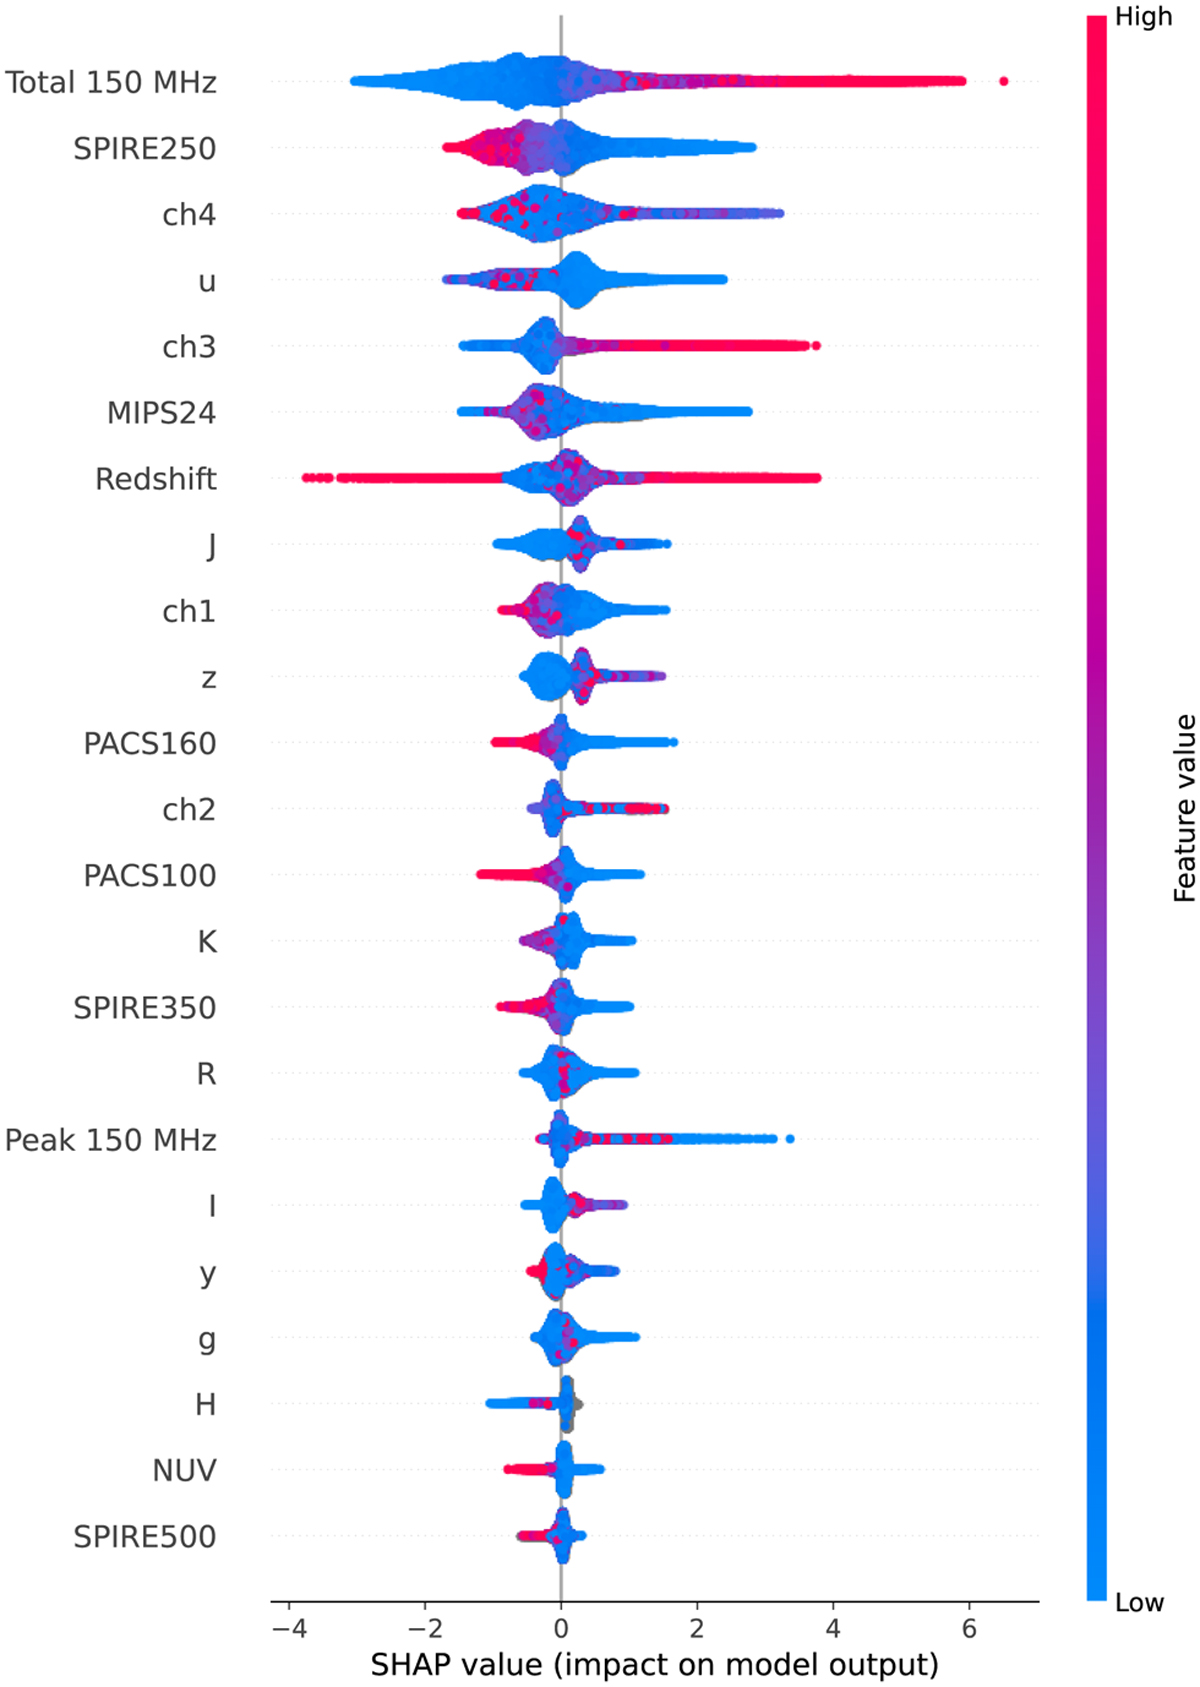
Feature importance using SHAP values. The features are ordered by importance from top to bottom, with the most important feature being at the top. On the x-axis, the SHAP value is displayed. A positive value indicates a higher probability that the associated source is an AGN, while a negative value is a higher probability that the source is an SFG. The value of the feature is shown via the colour, which is also displayed on the right in a colour bar. For instance, a higher radio flux results in a higher probability that the source is an AGN.
Current usage metrics show cumulative count of Article Views (full-text article views including HTML views, PDF and ePub downloads, according to the available data) and Abstracts Views on Vision4Press platform.
Data correspond to usage on the plateform after 2015. The current usage metrics is available 48-96 hours after online publication and is updated daily on week days.
Initial download of the metrics may take a while.