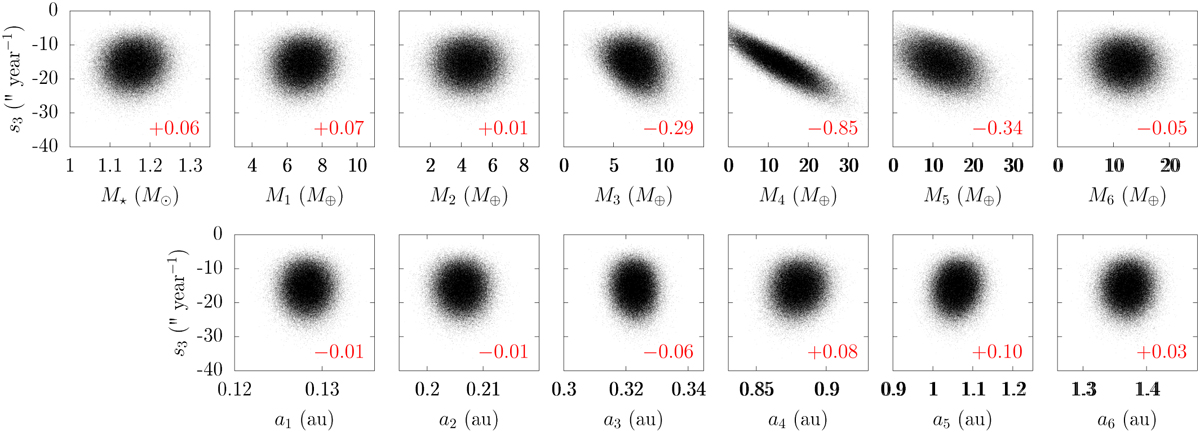
Fig. A.1
Download original image
Scatter plot of the proper frequency s3 and the 13 parameters involved (the stellar mass and the masses and semi-major axes of planets 1 to 6). The black dots show 150 000 realisations of the Lagrange-Laplace system with the mass and semi-major axis uncertainties from Table 1. The red label gives Spearman’s correlation coefficient ρS as computed from 106 realisations.
Current usage metrics show cumulative count of Article Views (full-text article views including HTML views, PDF and ePub downloads, according to the available data) and Abstracts Views on Vision4Press platform.
Data correspond to usage on the plateform after 2015. The current usage metrics is available 48-96 hours after online publication and is updated daily on week days.
Initial download of the metrics may take a while.