Fig. 3
Download original image
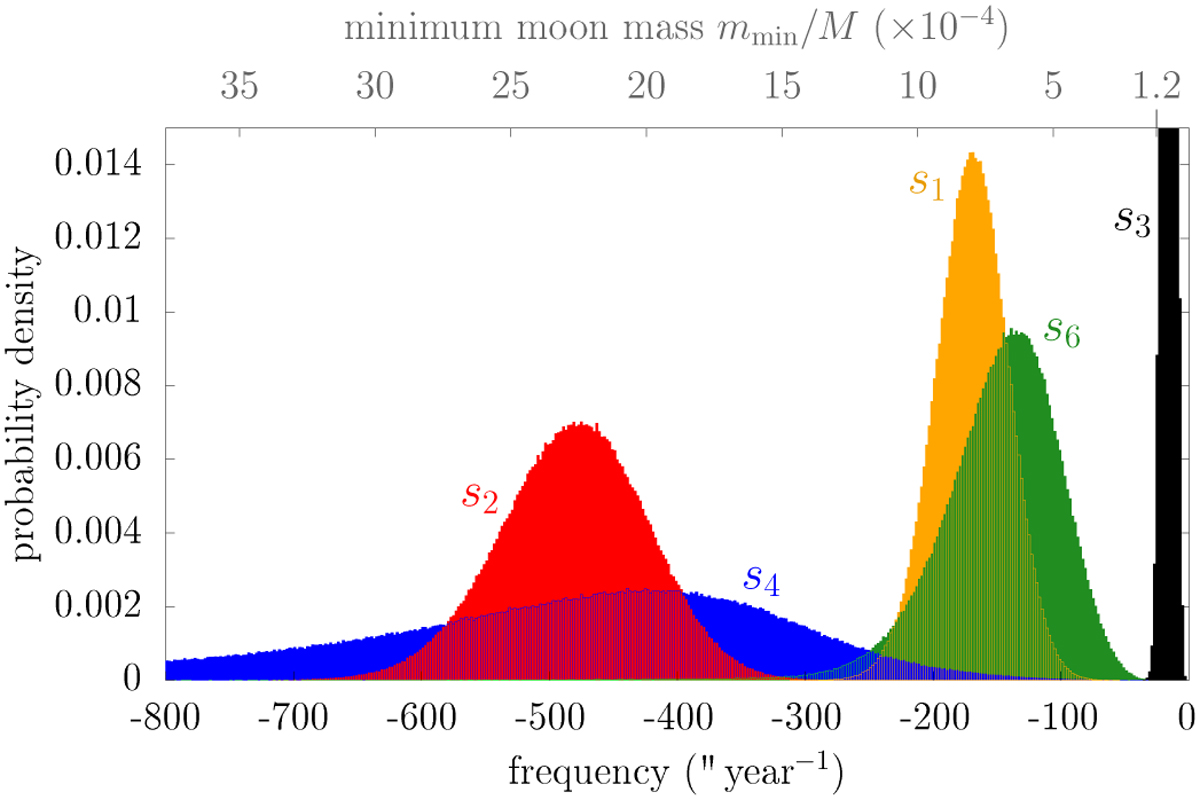
Probability density of the inclination proper modes of the HIP 41378 system. Histograms are built from 106 realisations of the Lagrange-Laplace system with the mass and semi-major axis uncertainties in Table 1. The histogram for frequency s4 has a long tail extending beyond the left border of the figure (with 99.7% occurrences above −1850″ yr−1 and 95.4% above −1000″ yr−1). The histogram for frequency s3 peaks above the top border of the figure. Frequency s5 is identically equal to zero from the conservation of angular momentum. The upper axis shows the minimum moon mass needed for HIP 41378 f to be fully tilted through a resonance with a given frequency value (see Sect. 4).
Current usage metrics show cumulative count of Article Views (full-text article views including HTML views, PDF and ePub downloads, according to the available data) and Abstracts Views on Vision4Press platform.
Data correspond to usage on the plateform after 2015. The current usage metrics is available 48-96 hours after online publication and is updated daily on week days.
Initial download of the metrics may take a while.