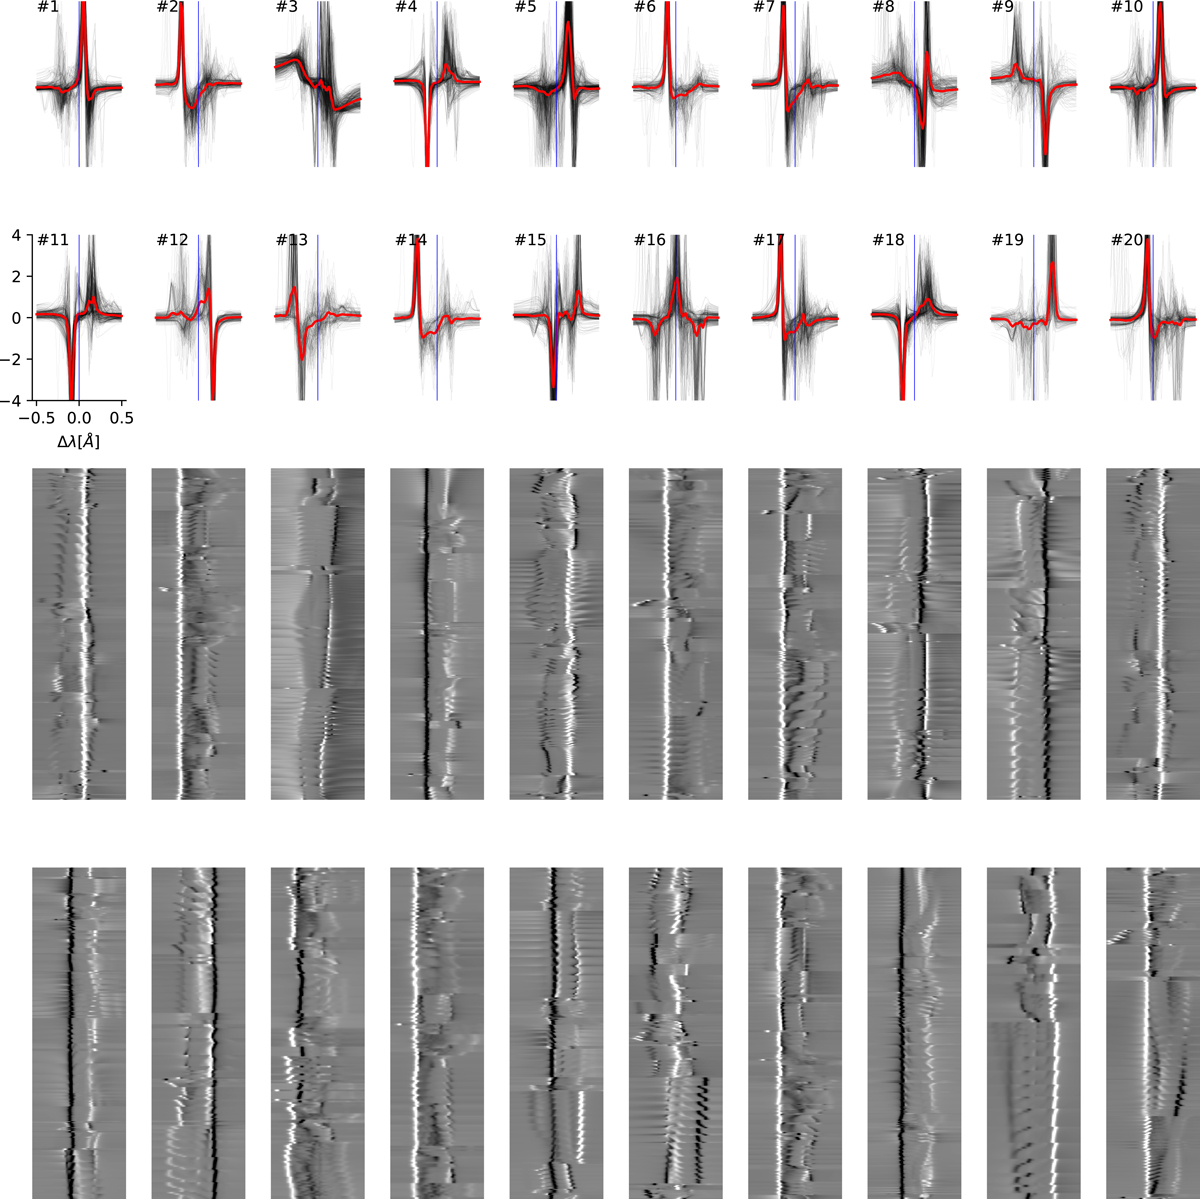
Fig. 8.
Download original image
k-means clusters for Stokes V profiles, using 20 clusters on z-normalized Stokes V. The red line is the cluster centroid (average), and the black lines are all individual profiles assigned to the cluster. The blue line is a visual aid that denotes the position of λ0. The bottom two rows show all the z-normalized Stokes V profiles belonging to the corresponding clusters in the two top rows, with the individual profiles stacked along the vertical axis. It should be noted that the clusters are not equally populated, so the grey-scale maps will have different densities of profiles along the vertical axis.
Current usage metrics show cumulative count of Article Views (full-text article views including HTML views, PDF and ePub downloads, according to the available data) and Abstracts Views on Vision4Press platform.
Data correspond to usage on the plateform after 2015. The current usage metrics is available 48-96 hours after online publication and is updated daily on week days.
Initial download of the metrics may take a while.