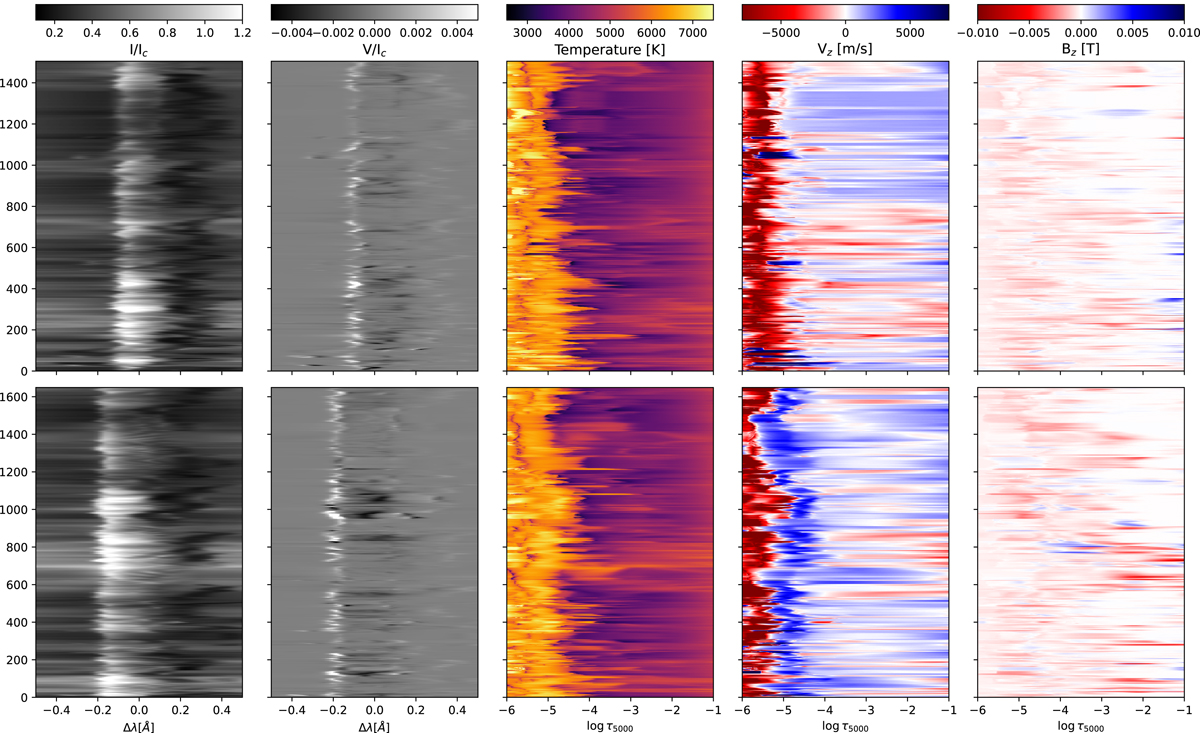
Fig. 4.
Download original image
Stokes I and V profiles for two clusters, along with some atmospheric parameters for their simulation columns. Here, we show the k-means clusters #70 (top row) and #72 (bottom row) from Fig. 2, both of which have CBG-like profiles. All profiles for each cluster are stacked along the vertical axes of the plots, so the y-axis merely counts the profile number. The left column shows the continuum-normalized intensity versus wavelength from line core. The second-from-left column shows the continuum-normalized Stokes V profiles. The last three columns show, respectively, the temperature, the line-of-sight velocity, and the line-of-sight magnetic field strength, as a function of log(τ5000).
Current usage metrics show cumulative count of Article Views (full-text article views including HTML views, PDF and ePub downloads, according to the available data) and Abstracts Views on Vision4Press platform.
Data correspond to usage on the plateform after 2015. The current usage metrics is available 48-96 hours after online publication and is updated daily on week days.
Initial download of the metrics may take a while.