Open Access
Fig. 2.
Download original image
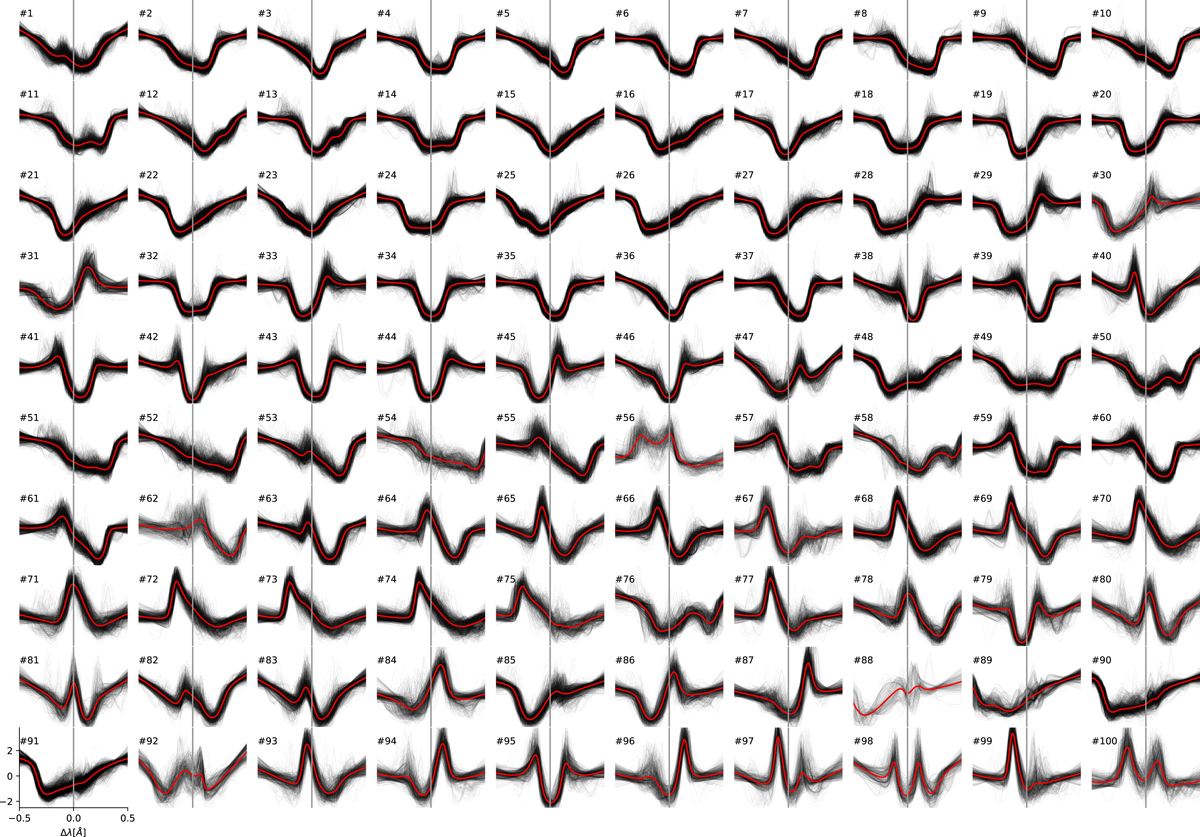
k-means clusters for synthetic Ca II 854.2 nm intensity profiles, using 100 clusters on z-normalized profiles. The red line is the cluster centroid profile (average), while the black lines are all individual profiles assigned to each cluster. The grey line is a visual aid that denotes the position of λ0.
Current usage metrics show cumulative count of Article Views (full-text article views including HTML views, PDF and ePub downloads, according to the available data) and Abstracts Views on Vision4Press platform.
Data correspond to usage on the plateform after 2015. The current usage metrics is available 48-96 hours after online publication and is updated daily on week days.
Initial download of the metrics may take a while.