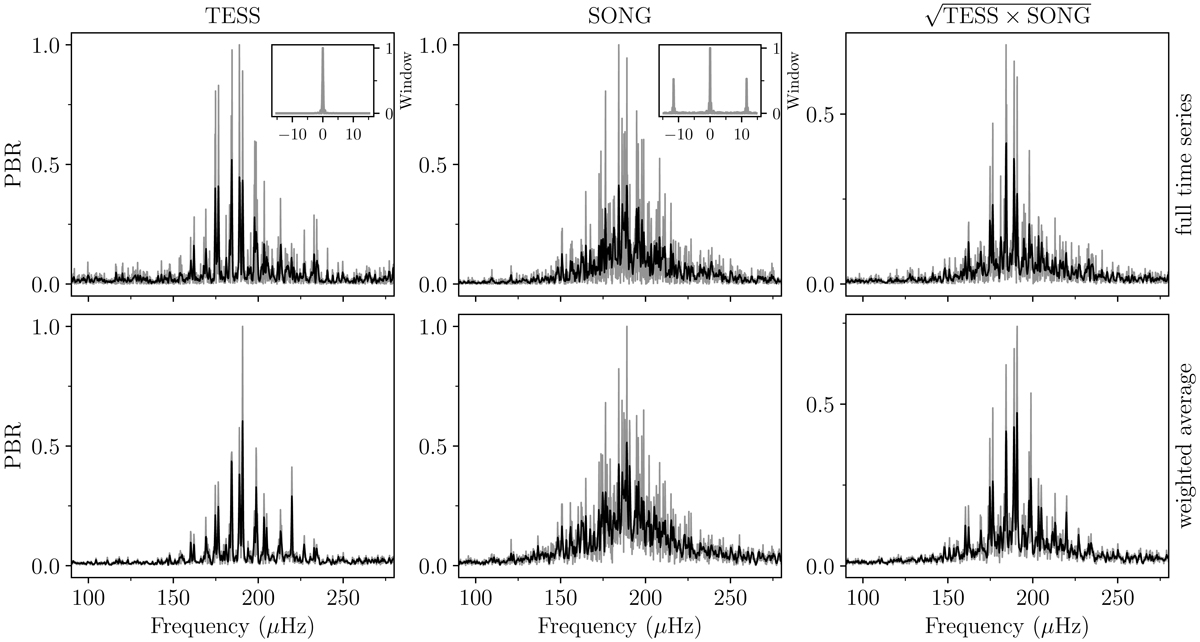
Fig. 4.
Download original image
TESS and SONG background-corrected, normalised power spectra. The power-to-background ratio (PBR) power spectra from TESS (left column) and SONG (middle) are shown in grey, and a smoothed (box-kernel) version is shown in black. The bottom row shows the weighted average power spectra, where we have taken the power spectrum for each sector or each campaign, divided by the fitted background, and created a weighted average. In the top row we have simply removed (divided) the background from the power spectra resulting from combining all sectors or all campaigns into the time series. The right column shows the product power spectra created from the full time series (top) and the weighted average power spectra (bottom). The insets in the top-left and top-middle panels show the spectral window from the full time series from TESS and SONG, respectively.
Current usage metrics show cumulative count of Article Views (full-text article views including HTML views, PDF and ePub downloads, according to the available data) and Abstracts Views on Vision4Press platform.
Data correspond to usage on the plateform after 2015. The current usage metrics is available 48-96 hours after online publication and is updated daily on week days.
Initial download of the metrics may take a while.