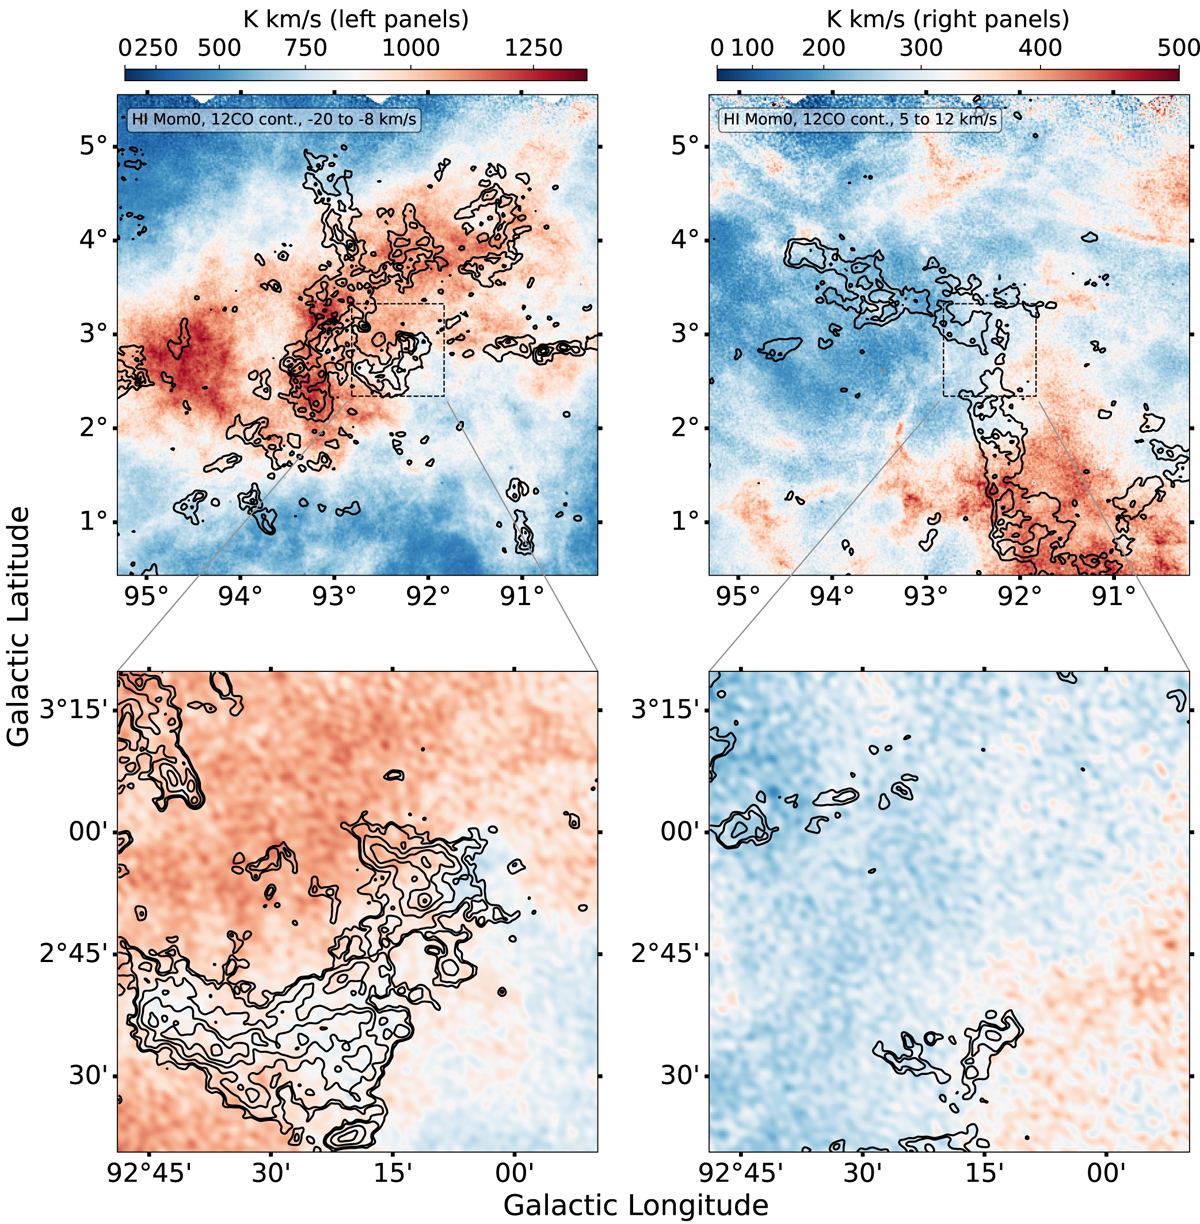
Fig. B.1.
Download original image
OPU 12CO(J = 2→1) emission in contours (Paper I) overlaid with the DRAO HI 21 cm moment-0 map (colours) in the velocity range from –20 to –8 km s−1 (left), and 5 to 12 km s−1 (right) at the same colour scale. The DRAO map with the Nobeyama 13CO is shown as an inset. The OPU contours are [-4, 4, 8, 12, 16, 20, 24,28,32] the rms of 1.0 K km s−1. The Nobeyama 13CO contours are [-4,4,5,8,12,16,20] the rms of 0.5 K km s−1.
Current usage metrics show cumulative count of Article Views (full-text article views including HTML views, PDF and ePub downloads, according to the available data) and Abstracts Views on Vision4Press platform.
Data correspond to usage on the plateform after 2015. The current usage metrics is available 48-96 hours after online publication and is updated daily on week days.
Initial download of the metrics may take a while.