Fig. A.2.
Download original image
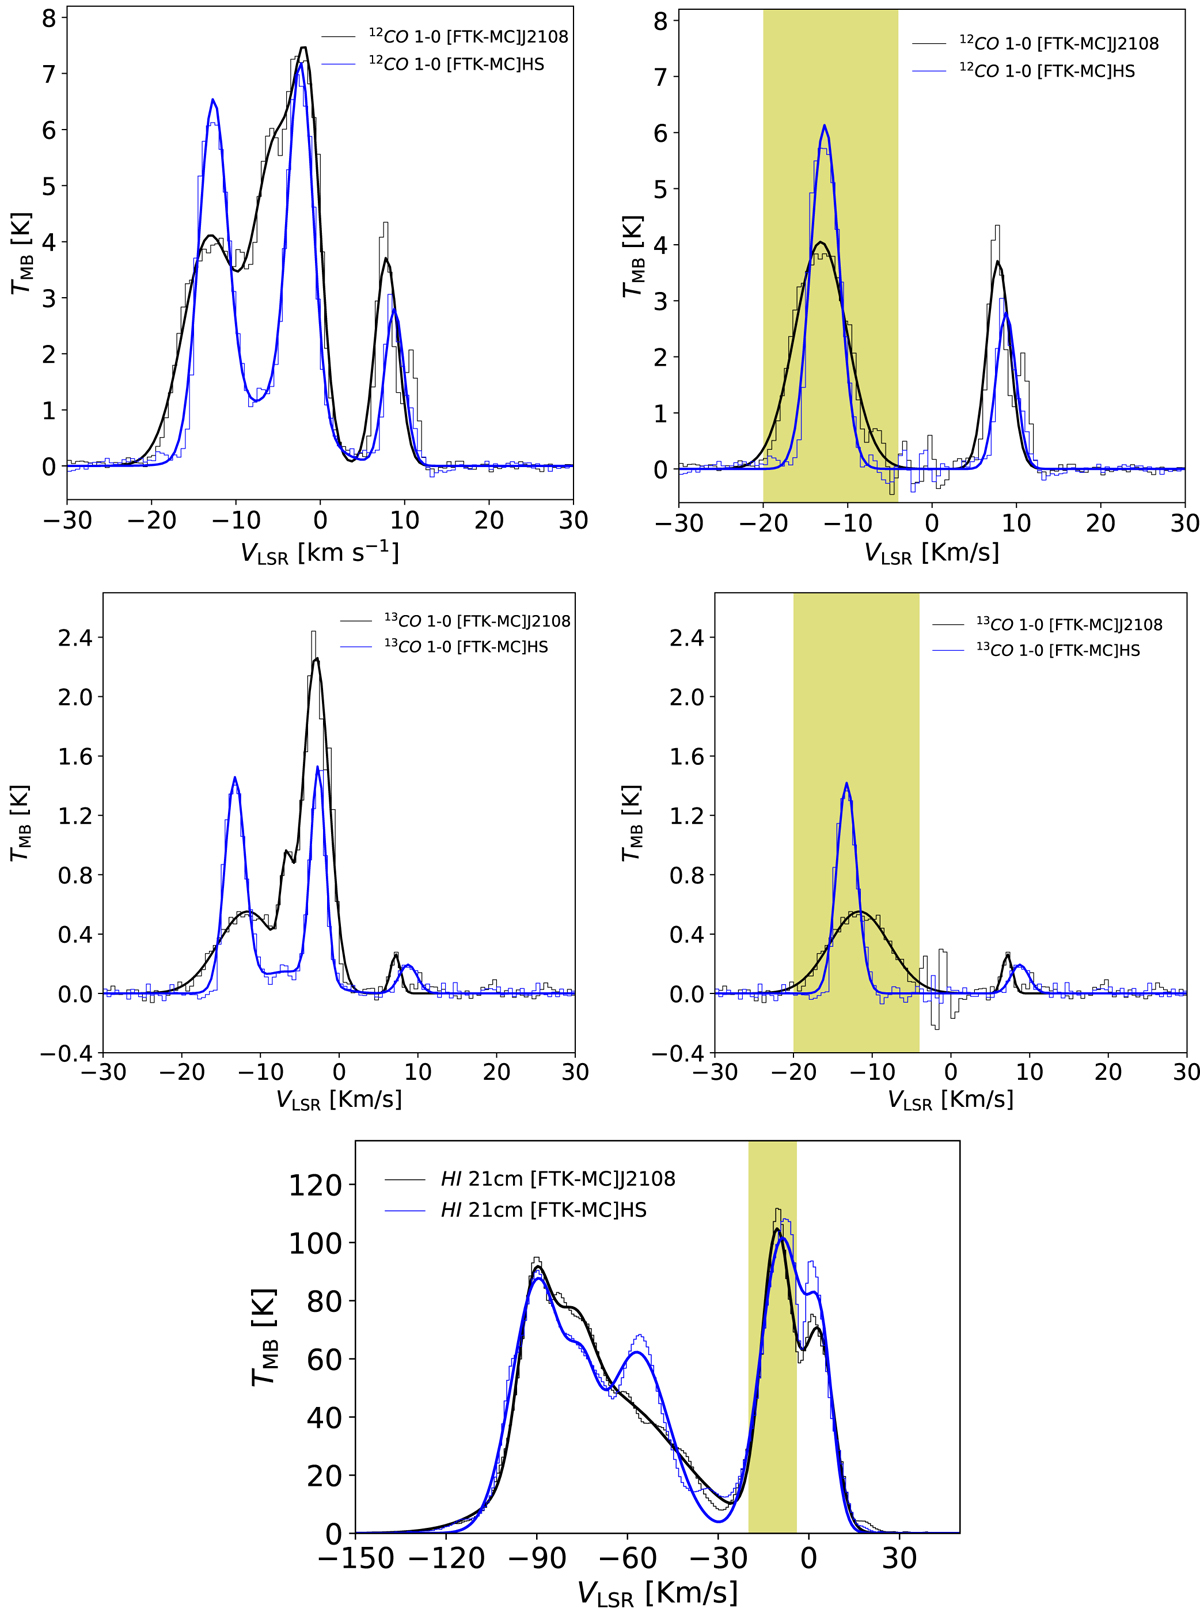
Gaussian fitted extracted spectra of [FTK–MC] in 12CO (top) and 13CO (middle) for the gas associated with regions [FTK–MC]J2108 (black solid line) and [FTK–MC]HS (blue solid lines; cf. Fig. 4). The three components C1 (left), C2 (middle), and C3 (right) mentioned in Figs. 2, 3, and A.1 are plotted. The corresponding spectra with the common C2 (–3 km s−1) subtracted are shown in the right panels. The DRAO HI 21 cm spectra for [FTK–MC]J2108 and [FTK–MC]HS is show at bottom. The shaded regions fill the LSR velocity range (–20 to 8 km s−1) of [FTK–MC] for 12, 13CO. They show the corresponding lines associated only with the gas of [FTK–MC].
Current usage metrics show cumulative count of Article Views (full-text article views including HTML views, PDF and ePub downloads, according to the available data) and Abstracts Views on Vision4Press platform.
Data correspond to usage on the plateform after 2015. The current usage metrics is available 48-96 hours after online publication and is updated daily on week days.
Initial download of the metrics may take a while.