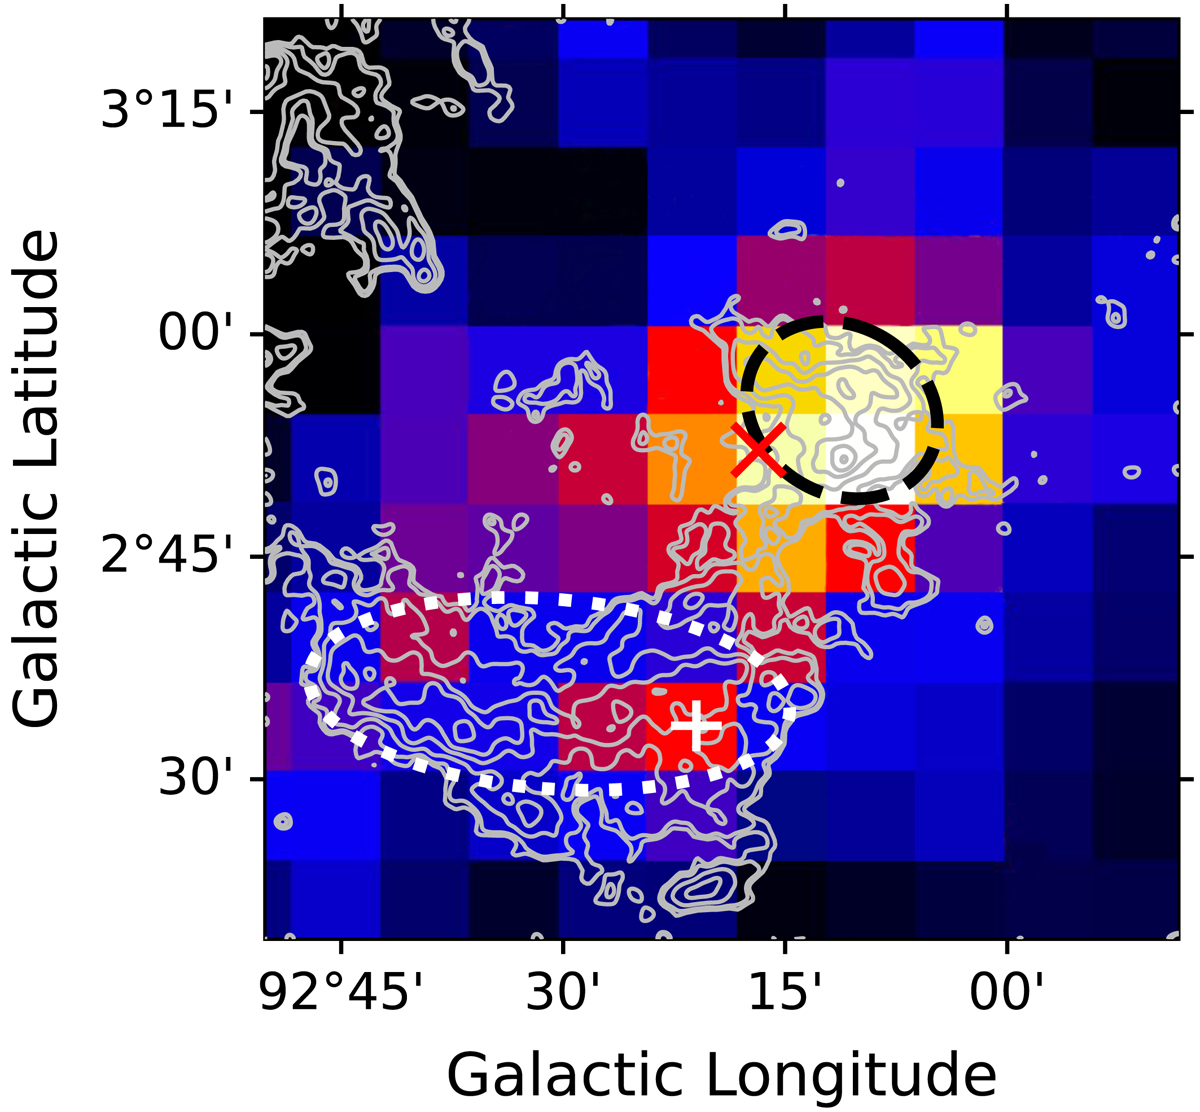
Fig. 4.
Download original image
Fermi-LAT map (in colours) from Fig. 1 with13CO moment 0 map overlaid as grey contours. The 13CO map was integrated between −20 and −8 km s−1. The contours are [−4,4,5,8,12,16,20] times the rms value of 0.5 K km s−1. The dashed black ([FTK-MC]J2108) and white dotted ([FTK-MC]HS) ellipses indicate the two regions where the physical parameters were determined. The cross (×) and the plus sign (+) cross indicate the central position of J2108 and HS, respectively.
Current usage metrics show cumulative count of Article Views (full-text article views including HTML views, PDF and ePub downloads, according to the available data) and Abstracts Views on Vision4Press platform.
Data correspond to usage on the plateform after 2015. The current usage metrics is available 48-96 hours after online publication and is updated daily on week days.
Initial download of the metrics may take a while.