Fig. 3.
Download original image
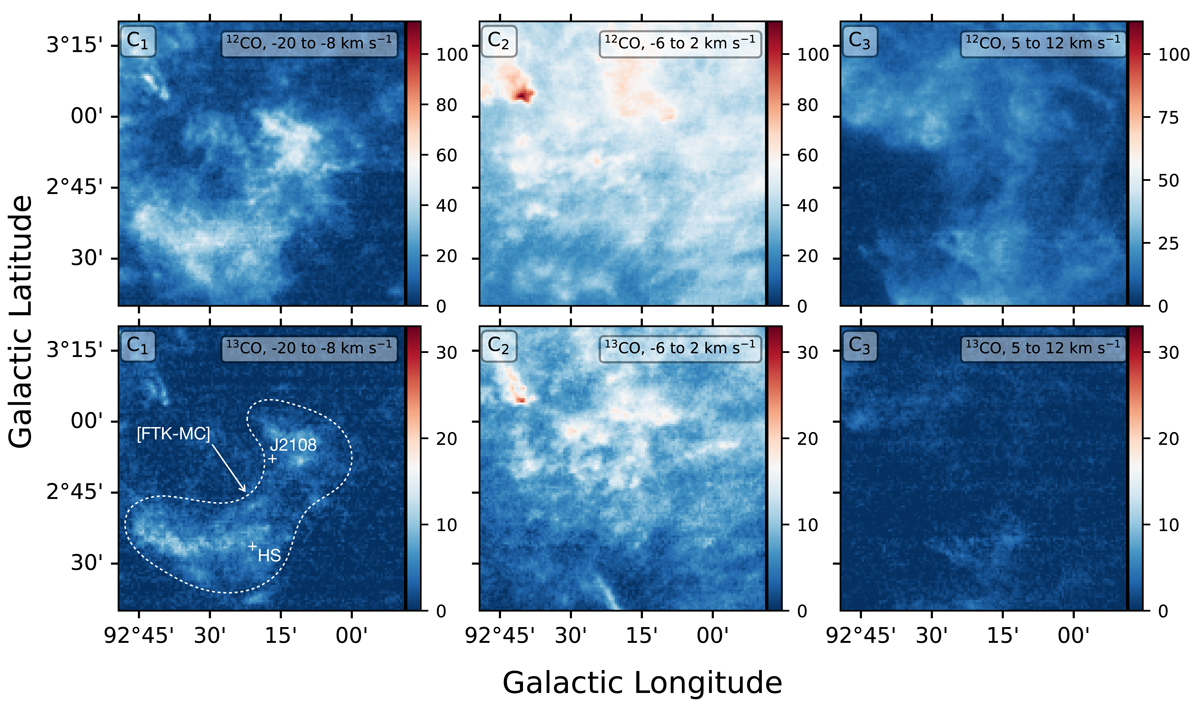
12, 13CO moment-0 maps of the three spectral components shown in the right panel of Fig. 2. The units of the colour-scale are K km s−1, corrected for antenna main-beam efficiency. The molecular cloud [FTK-MC] is most prominent in the map with velocity in the range from −20 to 8 km s−1, which corresponds to the spectral component C1, and is delineated with a dashed line. The positions of the sources J2108 and HS are indicated with crosses.
Current usage metrics show cumulative count of Article Views (full-text article views including HTML views, PDF and ePub downloads, according to the available data) and Abstracts Views on Vision4Press platform.
Data correspond to usage on the plateform after 2015. The current usage metrics is available 48-96 hours after online publication and is updated daily on week days.
Initial download of the metrics may take a while.