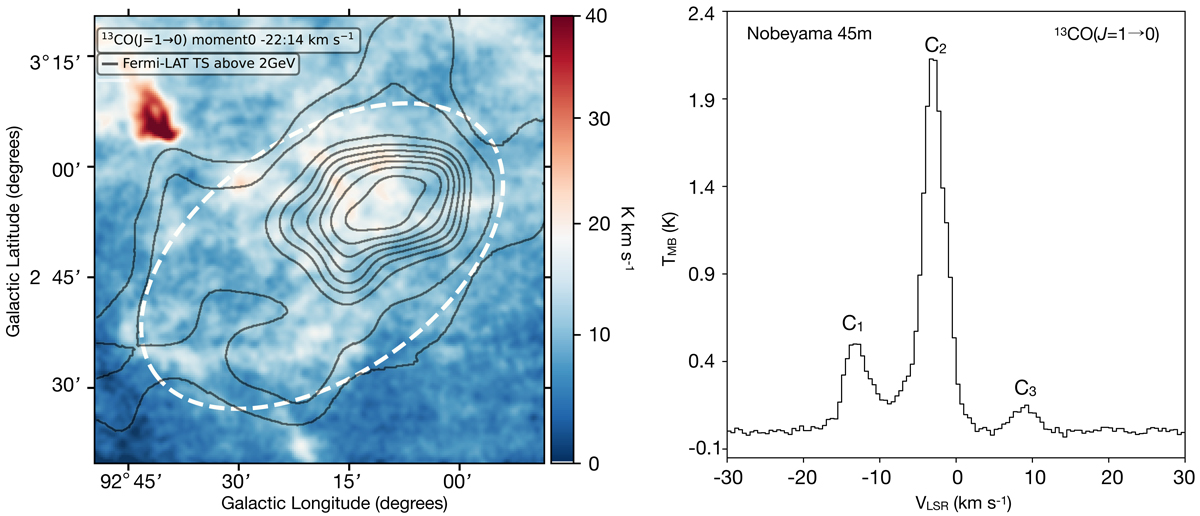
Fig. 2.
Download original image
13CO emission towards the vicinity of J2108. Left: 13CO moment-0 map, integrated between −22 and 14 km s−1, presented in a colour scale. The temperature scale has been corrected for main-beam efficiency. The Fermi-LAT TS map from Fig. 1 is overlaid with contours [10, 15, 30, 40, 50, 60, 70, 80, 90] in percentage of the maximum excess value. Right: spectrum of 13CO (J = 1 → 0) emission extracted from the area outlined by the dashed ellipse in the left panel, which covers the Fermi-LAT gamma-ray region of excess. Three spectral components are identified: C1, C2 and C3 centred at ∼−13, −3, and +9 km s−1 respectively.
Current usage metrics show cumulative count of Article Views (full-text article views including HTML views, PDF and ePub downloads, according to the available data) and Abstracts Views on Vision4Press platform.
Data correspond to usage on the plateform after 2015. The current usage metrics is available 48-96 hours after online publication and is updated daily on week days.
Initial download of the metrics may take a while.