Fig. 2
Download original image
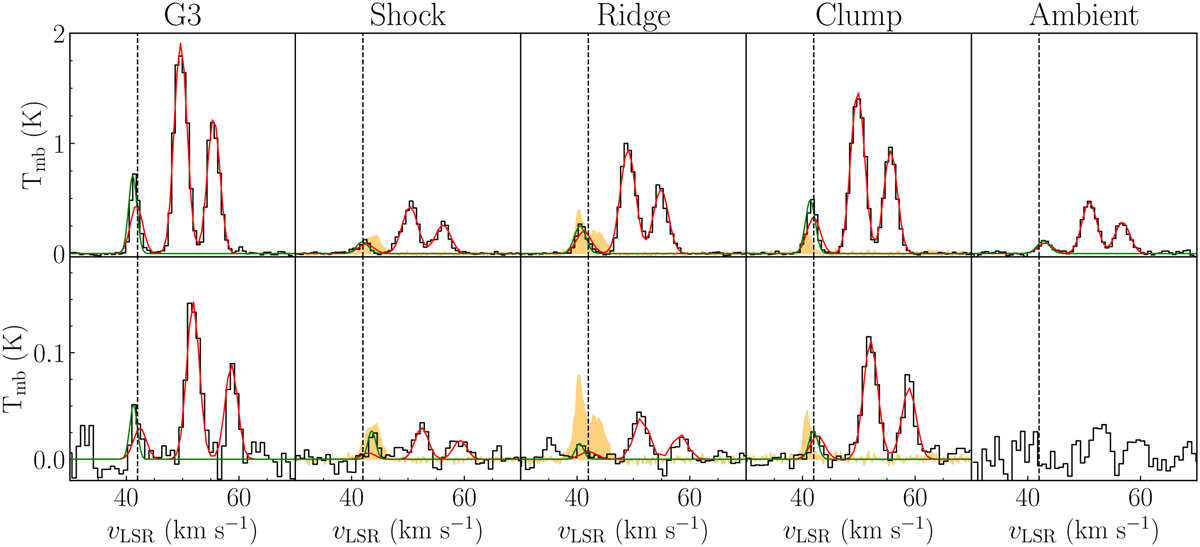
N2H+ (black curves, top panels) and N2D+ (black curves, bottom panels) obtained towards the five positions. The IRDC G34.77 central velocity is indicated as a vertical dotted line in all panels. The red curves show the best LTE fitting models obtained by MADCUBA. The green curves show the Gaussian fitting obtained for the isolated component. For the Shock, Ridge, and Clump positions, we report the SiO(2−1) spectra (orange filled) extracted from the ALMA images (Cosentino et al. 2019) towards an angular region consistent with that of our current observations (34″). In the bottom panels, the SiO spectra have been multiplied by 0.2 to allow a more straightforward comparison with the N2D+ spectra.
Current usage metrics show cumulative count of Article Views (full-text article views including HTML views, PDF and ePub downloads, according to the available data) and Abstracts Views on Vision4Press platform.
Data correspond to usage on the plateform after 2015. The current usage metrics is available 48-96 hours after online publication and is updated daily on week days.
Initial download of the metrics may take a while.