Fig. 1
Download original image
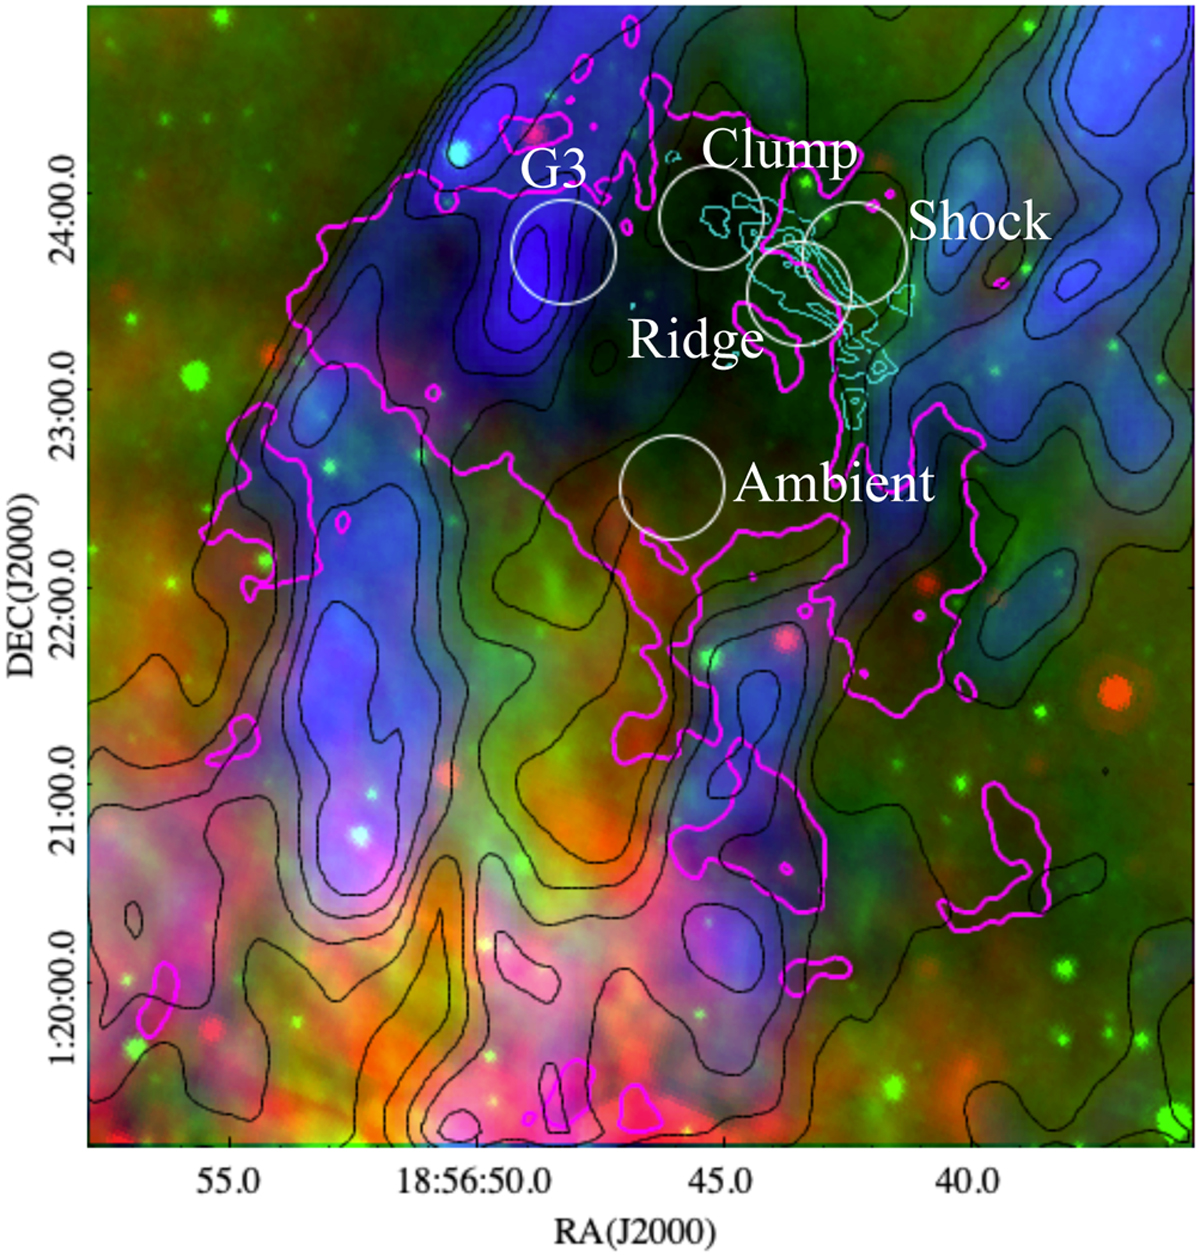
Three-colour image of G34.77. Red is 24 µm emission (Spitzer MIPSGAL; Carey et al. 2009), green is 8 µm emission (Spitzer GLIMPSE; Churchwell et al. 2009), and blue is 1 GHz continuum emission (THOR survey; Beuther et al. 2016; black contours from 3 to 27 Jy beam−1 by 6 Jy beam−1 ). The continuum emission probes the gas associated with the expanding shell of the SNR. The magenta contour (AV = 20 mag Kainulainen & Tan 2013) highlights the cloud shape. Superimposed on the map are the five positions of interest (white circles; 34″ IRAM 30 m beam at the N2D+ frequency of 77.112 GHz). The cyan contours correspond to the ALMA SiO contours from Cosentino et al. (2019; from 0.05 to 0.3 Jy beam−1 by 0.05 Jy beam−1).
Current usage metrics show cumulative count of Article Views (full-text article views including HTML views, PDF and ePub downloads, according to the available data) and Abstracts Views on Vision4Press platform.
Data correspond to usage on the plateform after 2015. The current usage metrics is available 48-96 hours after online publication and is updated daily on week days.
Initial download of the metrics may take a while.