Fig. 8.
Download original image
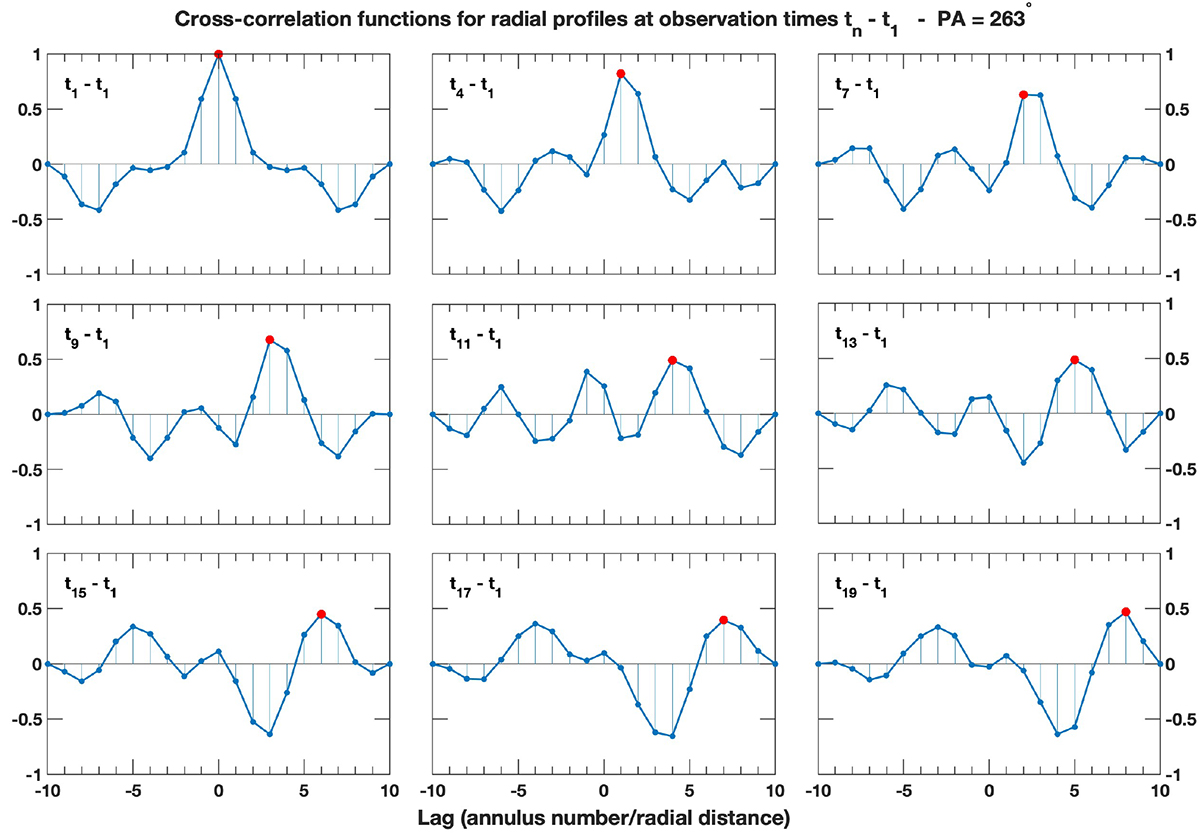
Cross-correlation functions of total brightness radial series at PA = 263° for some of the successive observation instants, labeled as tn. The lag value corresponds to the annulus position gap considered. The top-left panel shows the autocorrelation function of the radial series obtained at the instant t1. In the other panels, the cross-correlation functions between the radial series at instant tn and the radial series at instant t1 are reported. In each panel, the two instants at which the cross-correlated radial series have been collected are indicated in the top left. The red point in each panel highlights the maximum value of the cross-correlation function.
Current usage metrics show cumulative count of Article Views (full-text article views including HTML views, PDF and ePub downloads, according to the available data) and Abstracts Views on Vision4Press platform.
Data correspond to usage on the plateform after 2015. The current usage metrics is available 48-96 hours after online publication and is updated daily on week days.
Initial download of the metrics may take a while.