Fig. 6.
Download original image
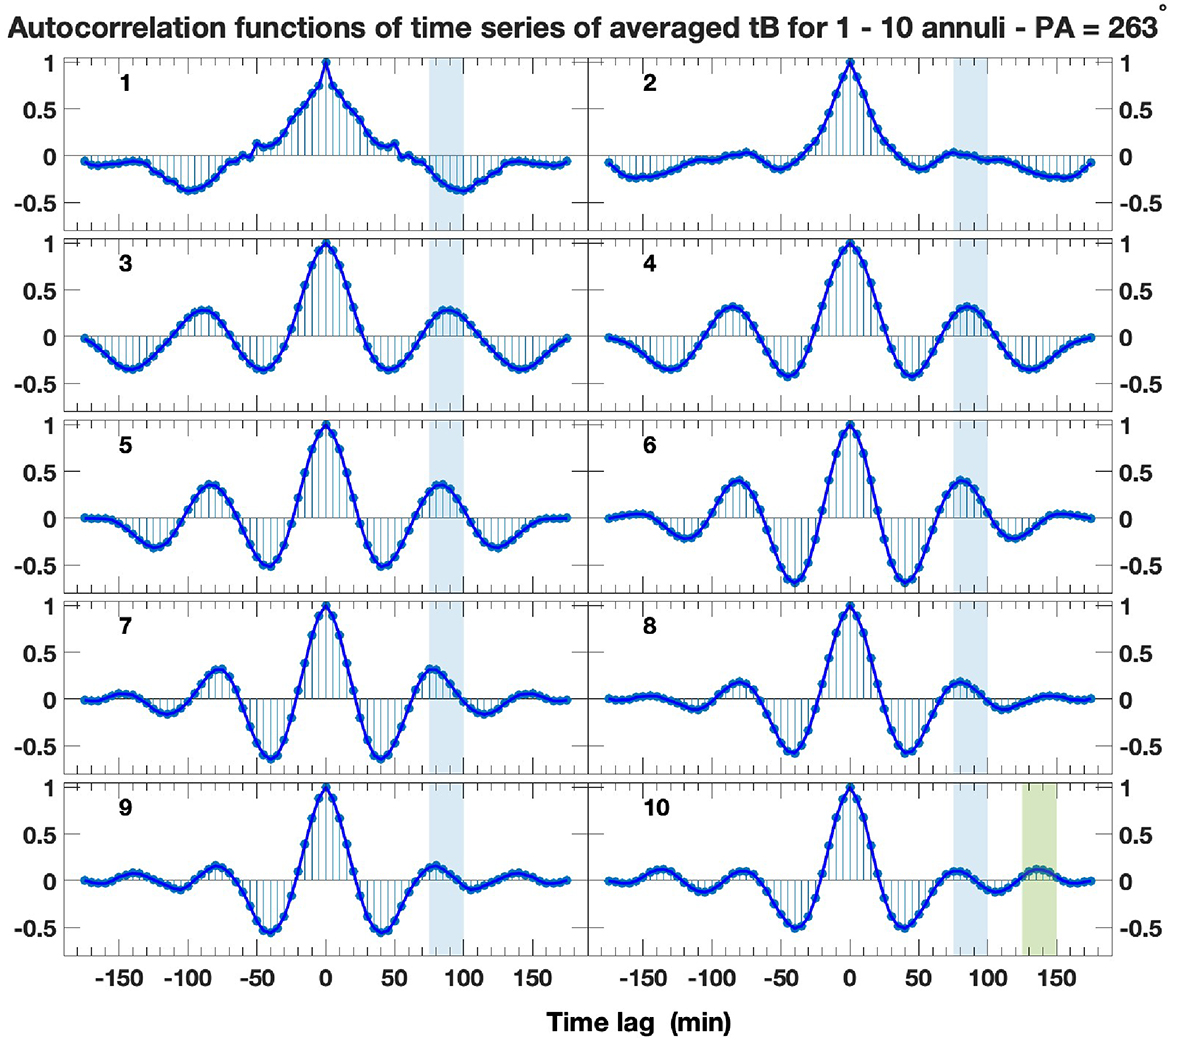
Autocorrelation functions of the time series of the visible-light total brightness relating to each annulus at PA = 263°. The lag values refer to the time lag being considered. In each panel, the corresponding annulus identification number is reported in the top left. A light blue shaded area highlights the interval of 75–100 min where all the autocorrelation functions (except that obtained for annulus 1) exhibit a secondary maximum. In the bottom-right panel, referring to the annulus 10, a light green shaded area highlights the interval of 125–150 min where the autocorrelation function exhibits its third maximum.
Current usage metrics show cumulative count of Article Views (full-text article views including HTML views, PDF and ePub downloads, according to the available data) and Abstracts Views on Vision4Press platform.
Data correspond to usage on the plateform after 2015. The current usage metrics is available 48-96 hours after online publication and is updated daily on week days.
Initial download of the metrics may take a while.