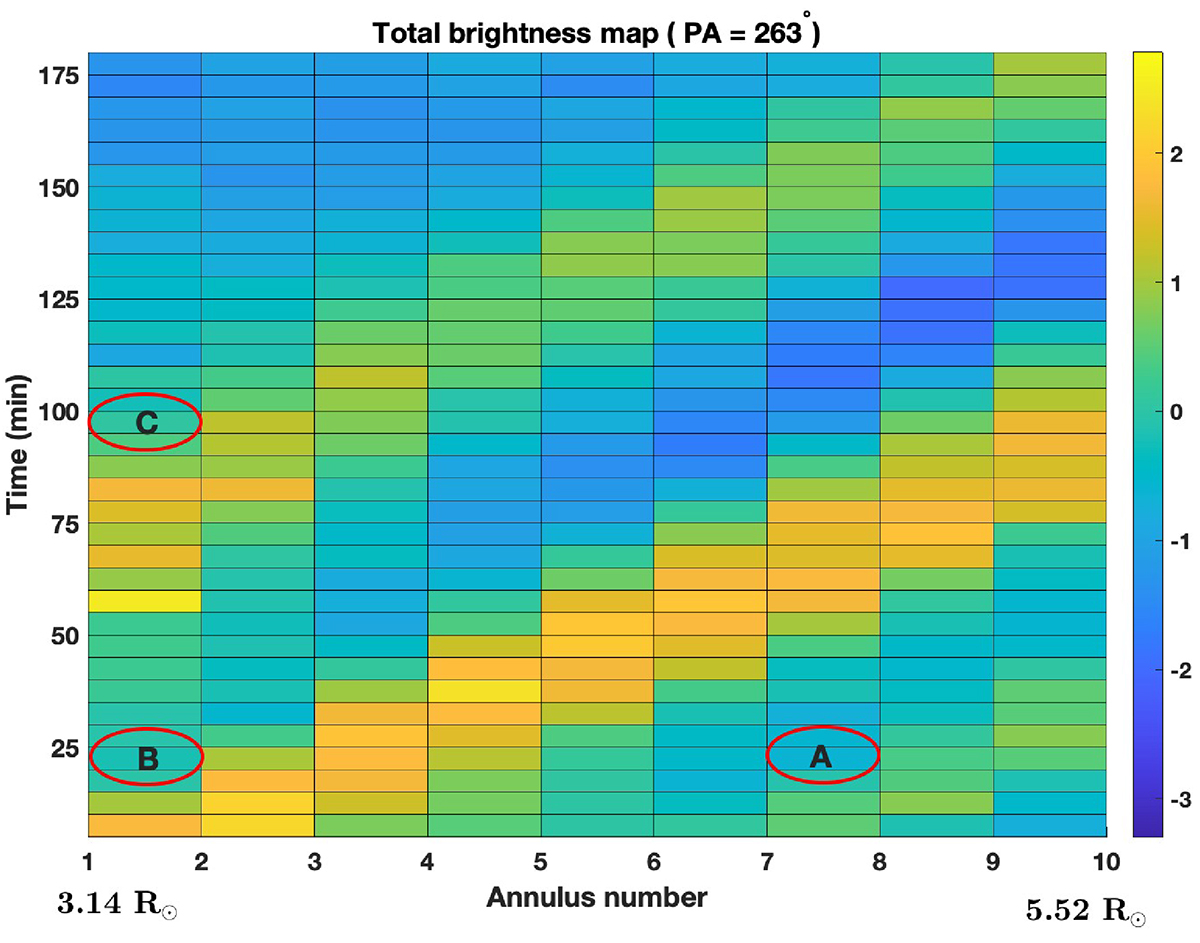
Fig. 5.
Download original image
Map of total brightness intensity as a function of time and heliocentric distance for the polar angle PA = 263°. Each time series of total brightness was normalized to zero mean and unit standard deviation. The labels A, B, and C indicate three different coronal density structures crossing the Metis FOV during the observing interval.
Current usage metrics show cumulative count of Article Views (full-text article views including HTML views, PDF and ePub downloads, according to the available data) and Abstracts Views on Vision4Press platform.
Data correspond to usage on the plateform after 2015. The current usage metrics is available 48-96 hours after online publication and is updated daily on week days.
Initial download of the metrics may take a while.