Fig. 4.
Download original image
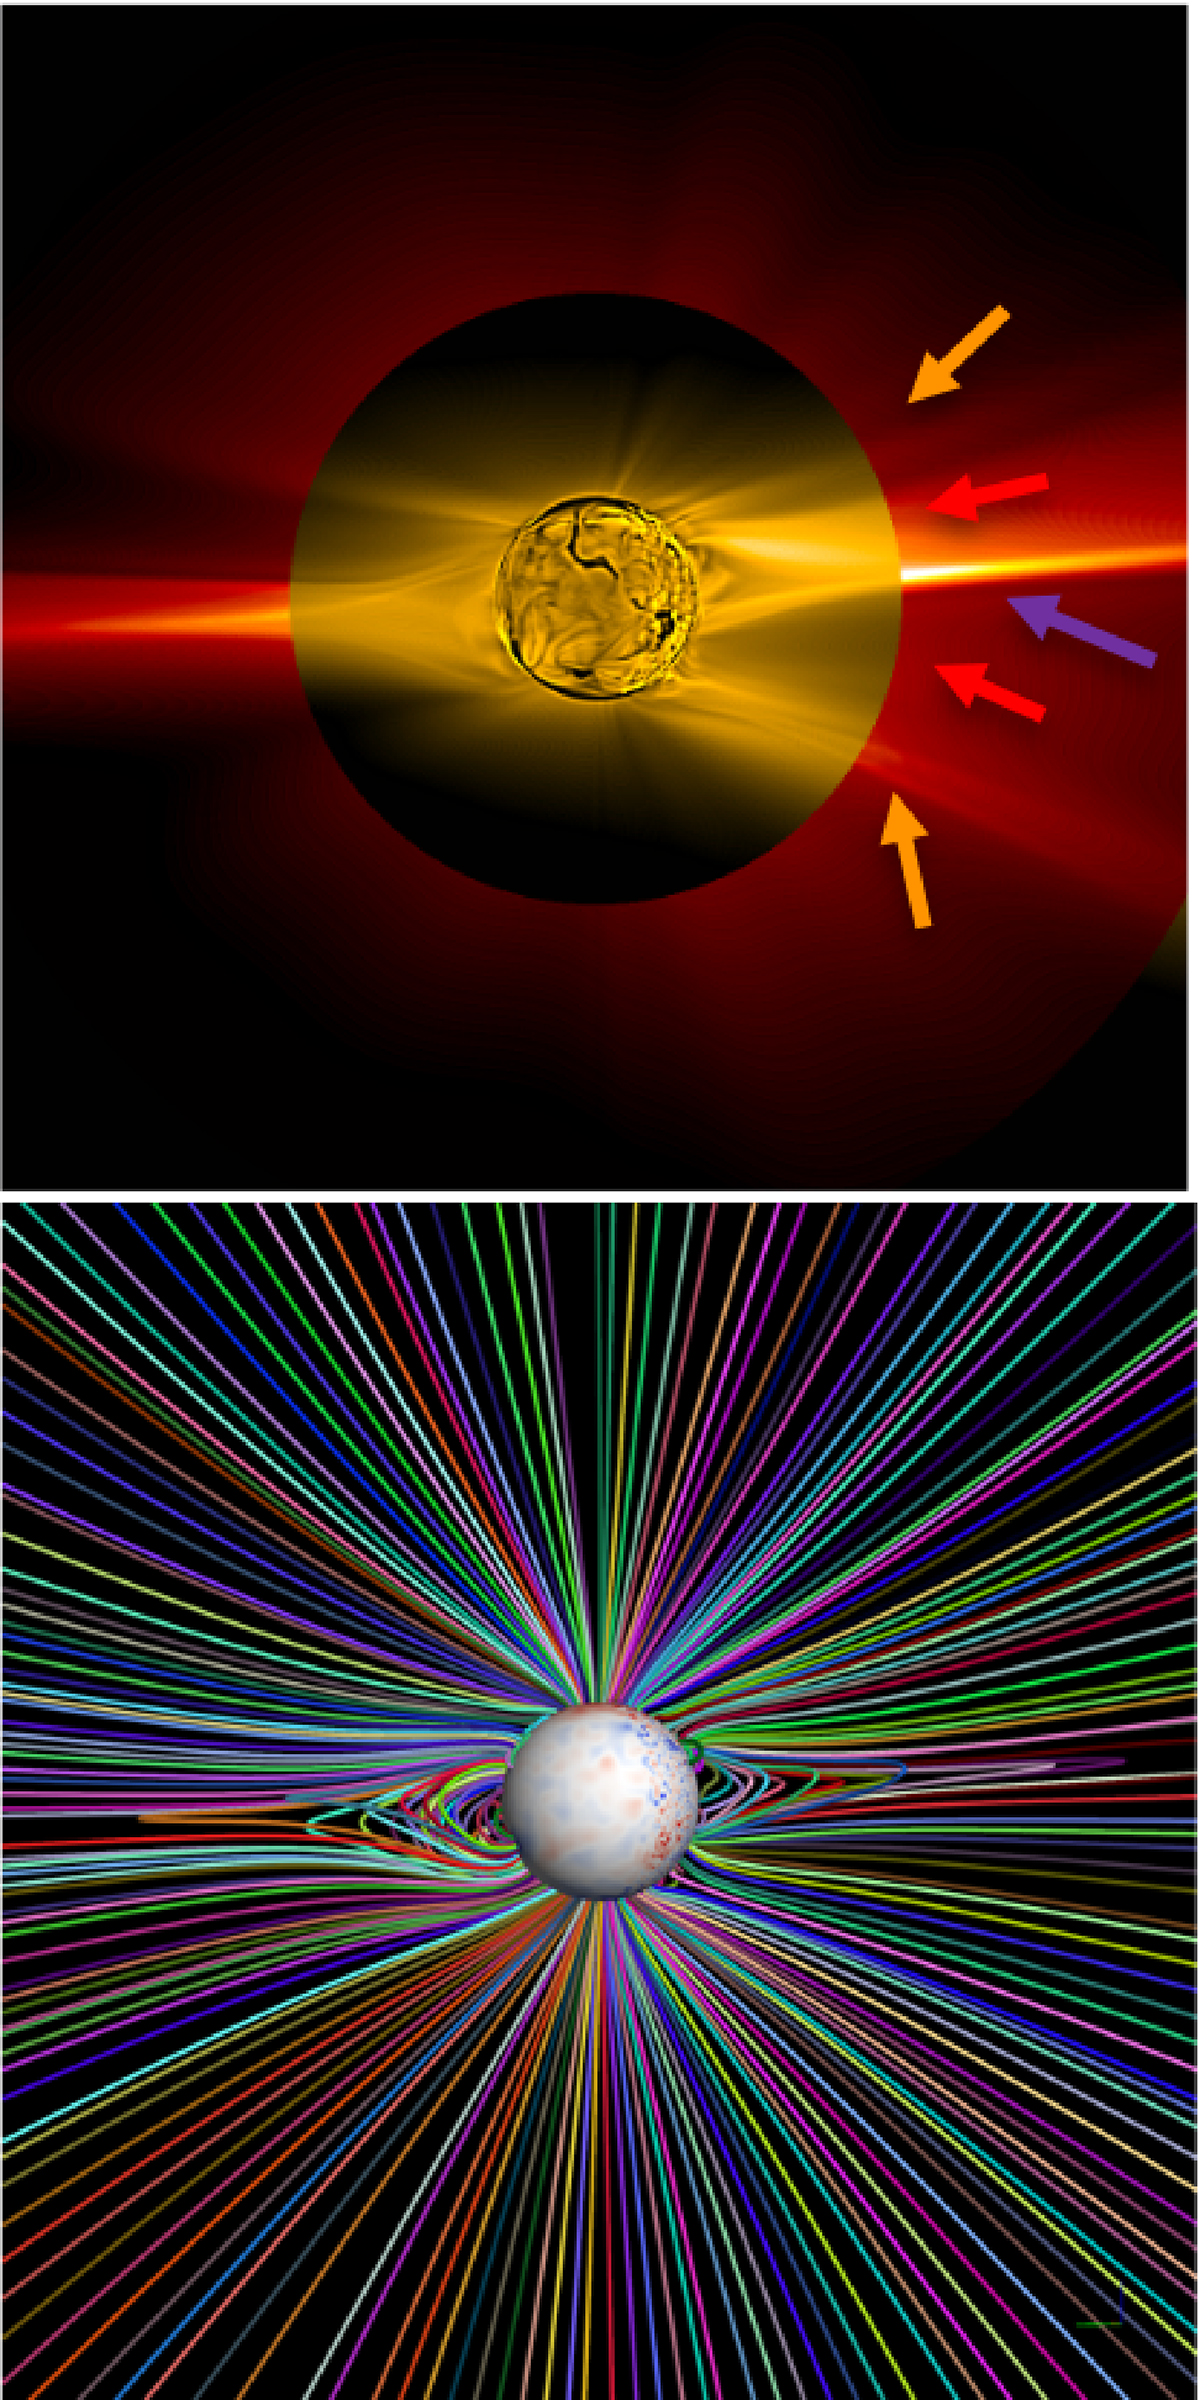
Comparison of the observed and modeled polarized brightness of the corona. Top panel: Radially filtered polarized brightness of the solar corona from the limb to the outer edge of the Metis FOV resulting from the Predictive Science Inc. 3D MHD simulations computed to reflect the limb view of Metis. The polarized brightness image was combined with the Atmospheric Imaging Assembly on the Solar Dynamics Observatory (Lemen et al. 2012) observations of the 17.1 nm EUV emission. The blue arrow indicates the streamer, the orange arrows show the pseudostreamers, and the red arrows indicate the regions of the wind emanating from the coronal hole extensions (same color code as in Fig. 10). Bottom panel: Magnetic field lines traced on the POS on the basis of the 3D MHD model of the corona.
Current usage metrics show cumulative count of Article Views (full-text article views including HTML views, PDF and ePub downloads, according to the available data) and Abstracts Views on Vision4Press platform.
Data correspond to usage on the plateform after 2015. The current usage metrics is available 48-96 hours after online publication and is updated daily on week days.
Initial download of the metrics may take a while.