Fig. 2.
Download original image
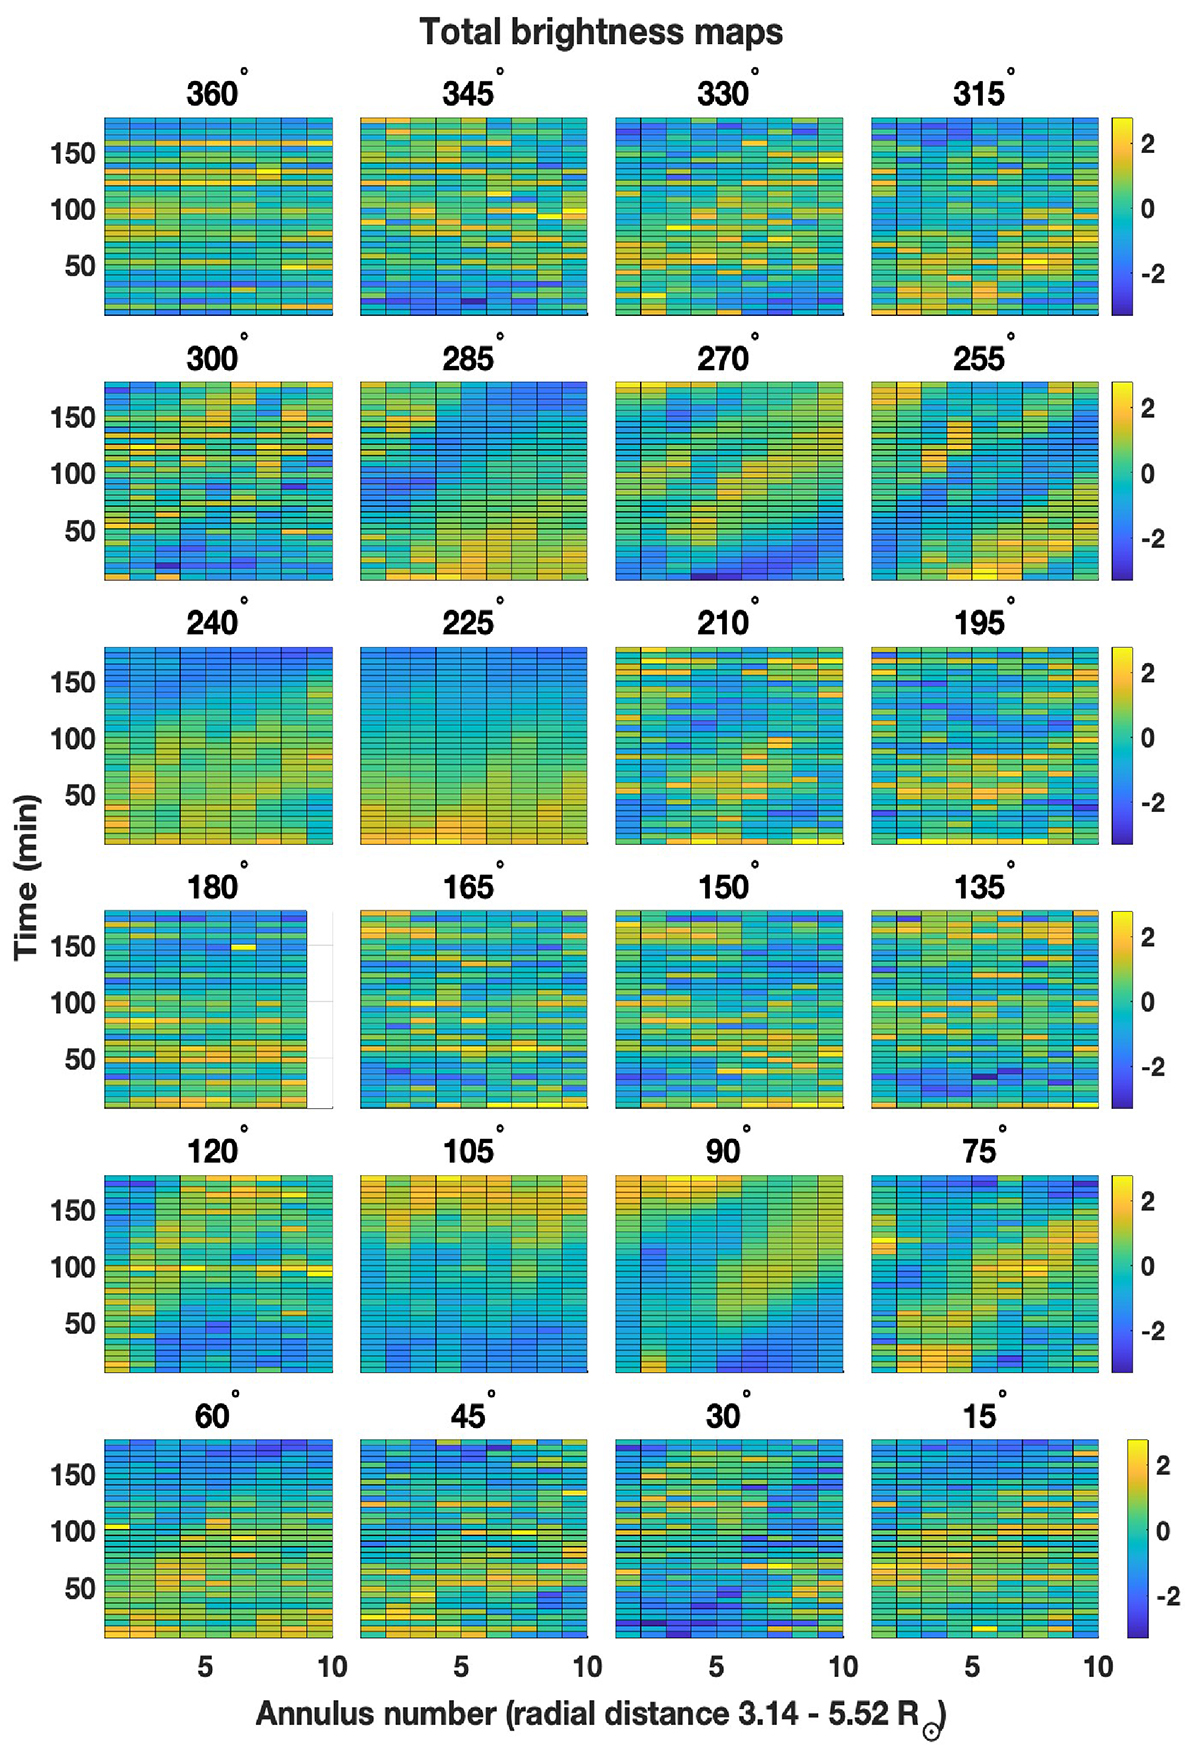
Maps of total brightness intensity as a function of time and heliocentric distance for the 24 radial directions considered in the analysis. Each time series of total brightness was normalized to zero mean and unit standard deviation. The radial directions are indicated at the top of the corresponding panel in terms of the PA value, measured counterclockwise from the north pole. In the map referring to PA = 180°, the data corresponding to the tenth annulus are missing since they were outside the Metis FOV.
Current usage metrics show cumulative count of Article Views (full-text article views including HTML views, PDF and ePub downloads, according to the available data) and Abstracts Views on Vision4Press platform.
Data correspond to usage on the plateform after 2015. The current usage metrics is available 48-96 hours after online publication and is updated daily on week days.
Initial download of the metrics may take a while.