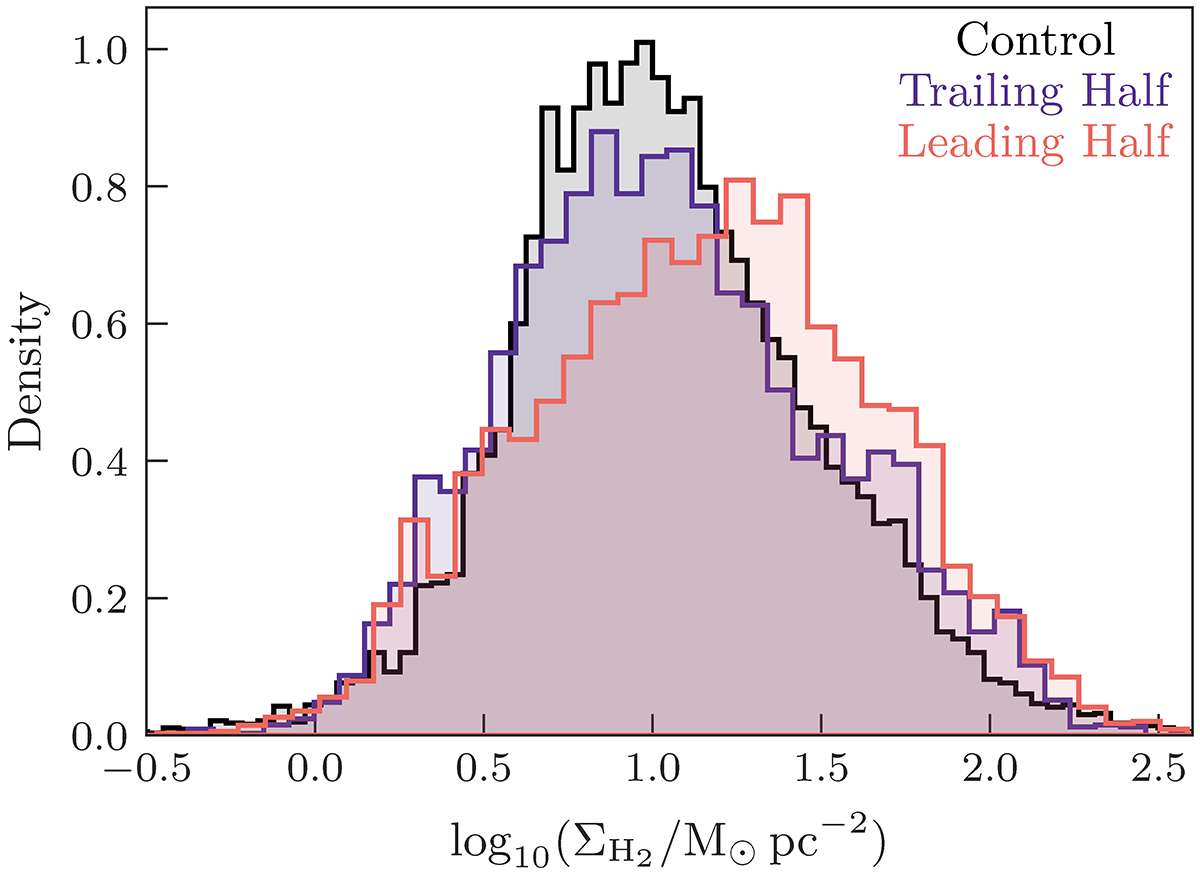
Fig. 8.
Download original image
H2 surface density distributions for detected pixels in control sample galaxies (black) as well as detected pixels on the leading half (orange) and trailing half (purple) of H I-tailed galaxies. H2 surface density distributions are taken from the 720 pc resolution maps. Bin widths are set according to Knuth’s rule (Knuth 2006) using the histogram functionality within astropy.visualization. Compared to the control and trailing half, pixels on the leading half are skewed towards higher H2 surface densities.
Current usage metrics show cumulative count of Article Views (full-text article views including HTML views, PDF and ePub downloads, according to the available data) and Abstracts Views on Vision4Press platform.
Data correspond to usage on the plateform after 2015. The current usage metrics is available 48-96 hours after online publication and is updated daily on week days.
Initial download of the metrics may take a while.