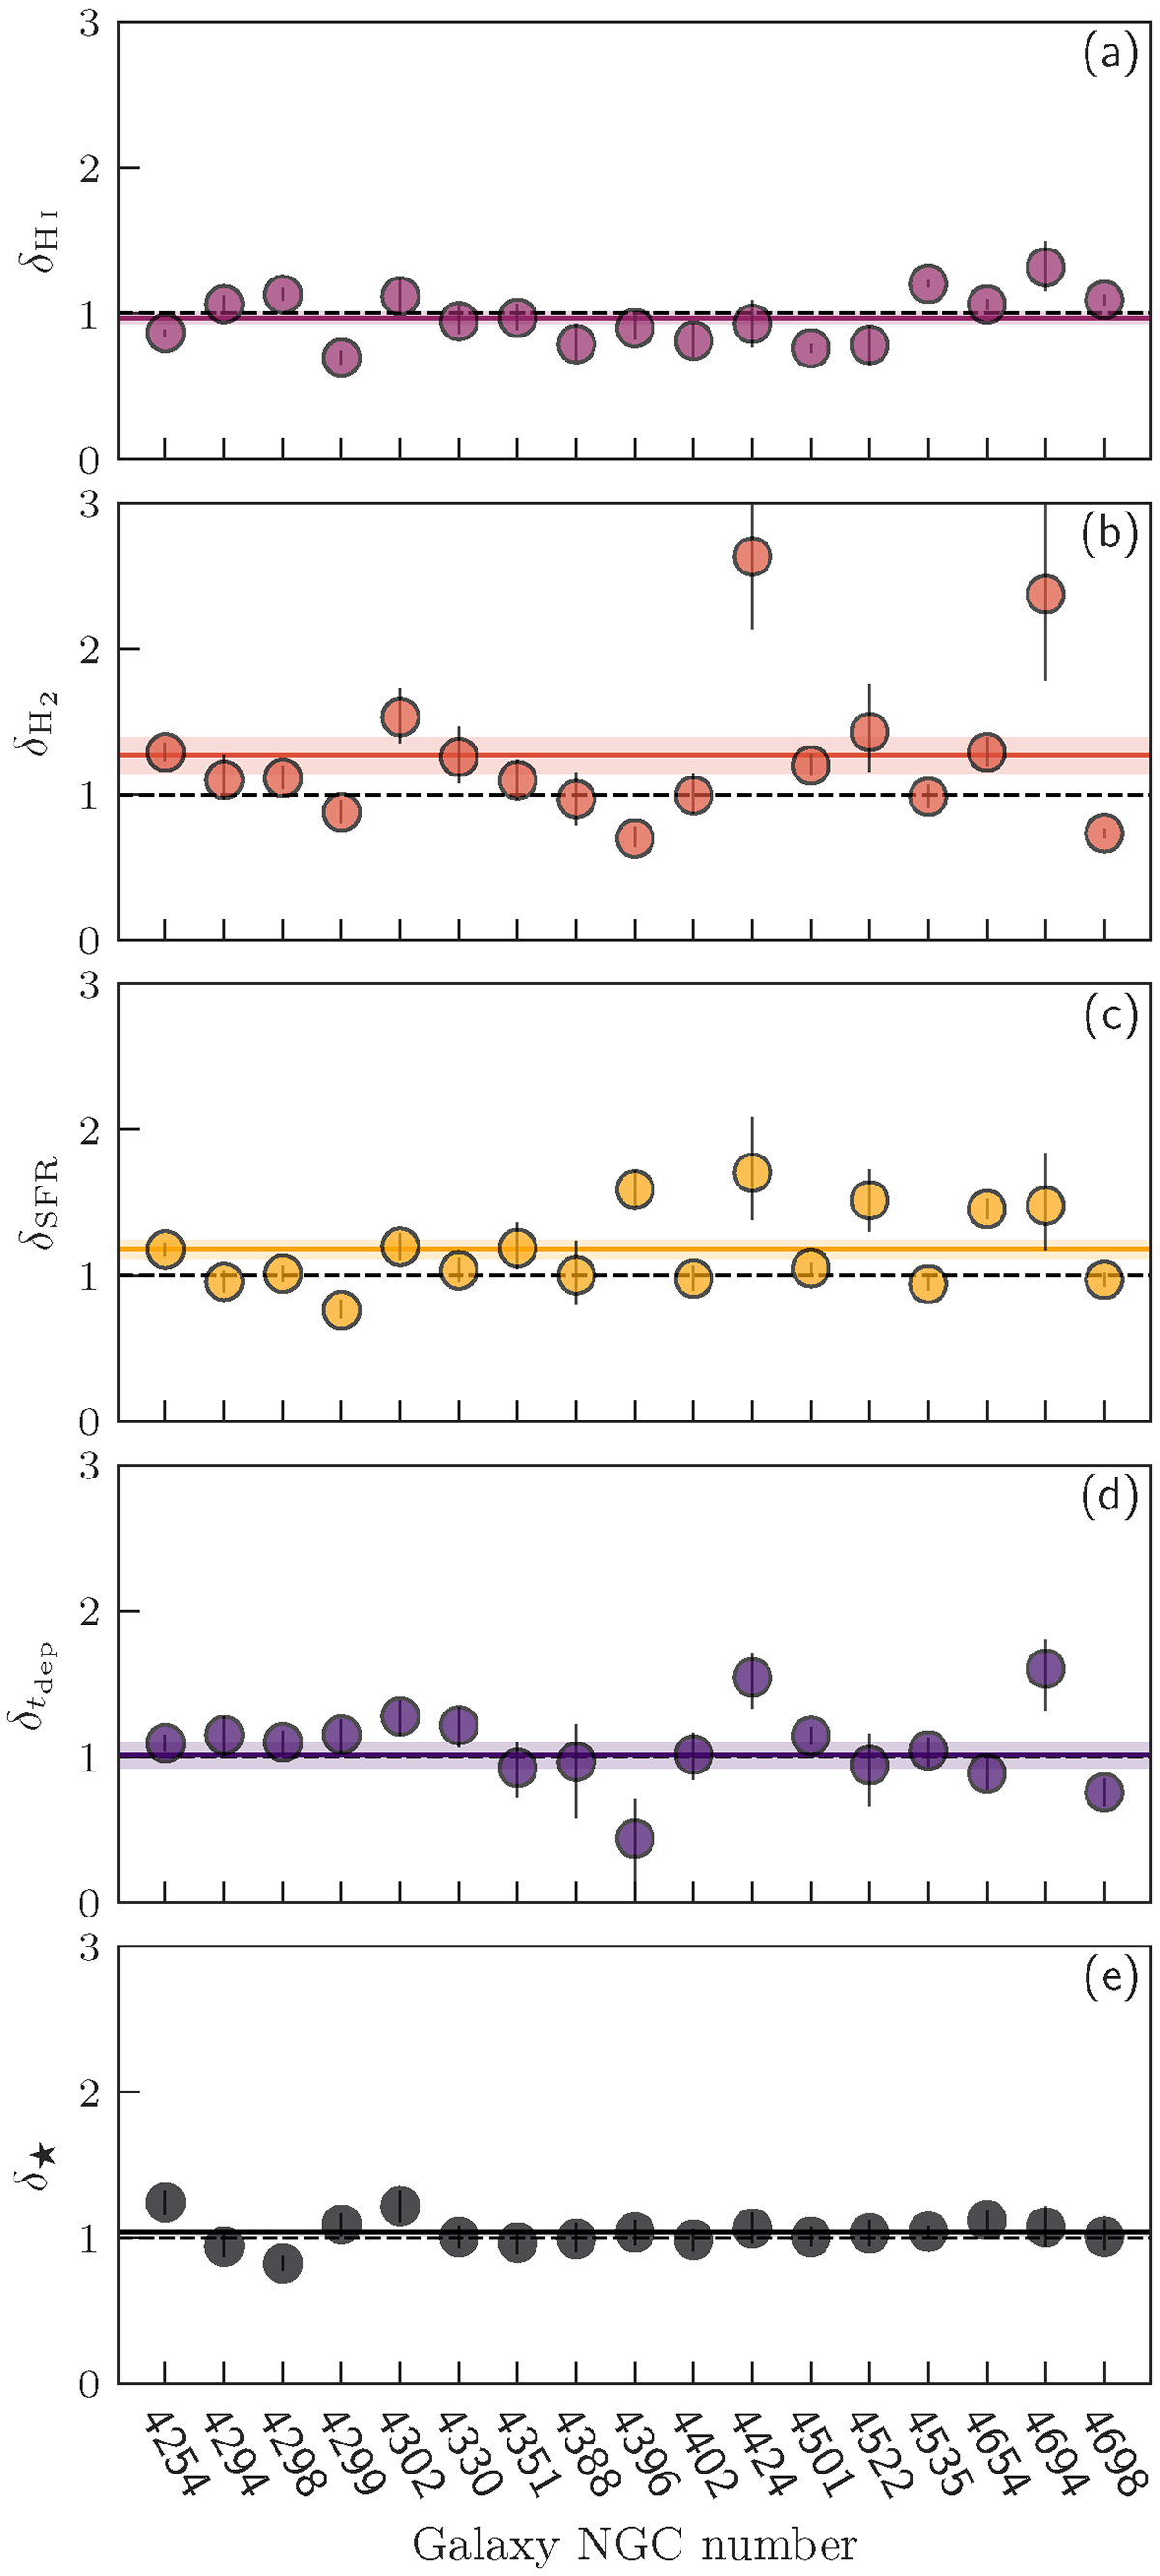
Fig. 6.
Download original image
Anisotropies between the leading and trailing halves of H I-tailed galaxies (see the main text for details). From top to bottom we show: the atomic gas mass, molecular gas mass, SFR, molecular gas depletion time, and stellar mass. Solid lines and shaded bands mark the median and statistical error on the median. Both errors on the median and error bars on the data points are derived from bootstrap resampling. Both H2 and SFR show excess emission on the leading half.
Current usage metrics show cumulative count of Article Views (full-text article views including HTML views, PDF and ePub downloads, according to the available data) and Abstracts Views on Vision4Press platform.
Data correspond to usage on the plateform after 2015. The current usage metrics is available 48-96 hours after online publication and is updated daily on week days.
Initial download of the metrics may take a while.