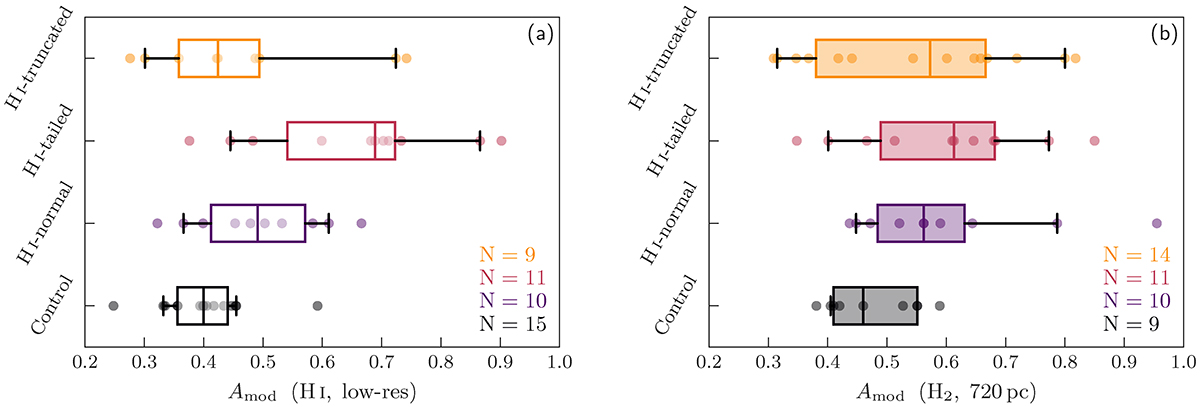
Fig. 4.
Download original image
Gas asymmetries as a function of the Yoon et al. (2017) H I stripping class. The left-hand panel shows individual measurements (circles) as well as box plots for atomic gas asymmetries from VIVA and THINGS (control) H I maps from the low-res sample (average resolution, 1.4 kpc). The right-hand panel shows individual measurements as well as box plots for molecular gas asymmetries measured from VERTICO and HERACLES (control) H2 maps at 720 pc resolution. For the box plots: boxes span the interquartile range for each class, the solid vertical line marks the median, and the whiskers range from the 5th to the 95th percentile of the distribution. The numbers in the lower right of each panel indicate the number of galaxies in each class that pass the requisite quality cuts (see Sect. 2.4). While there are similar qualitative patterns between H I and H2 asymmetries, the magnitude of the difference between classes is clearly larger for H I asymmetry.
Current usage metrics show cumulative count of Article Views (full-text article views including HTML views, PDF and ePub downloads, according to the available data) and Abstracts Views on Vision4Press platform.
Data correspond to usage on the plateform after 2015. The current usage metrics is available 48-96 hours after online publication and is updated daily on week days.
Initial download of the metrics may take a while.