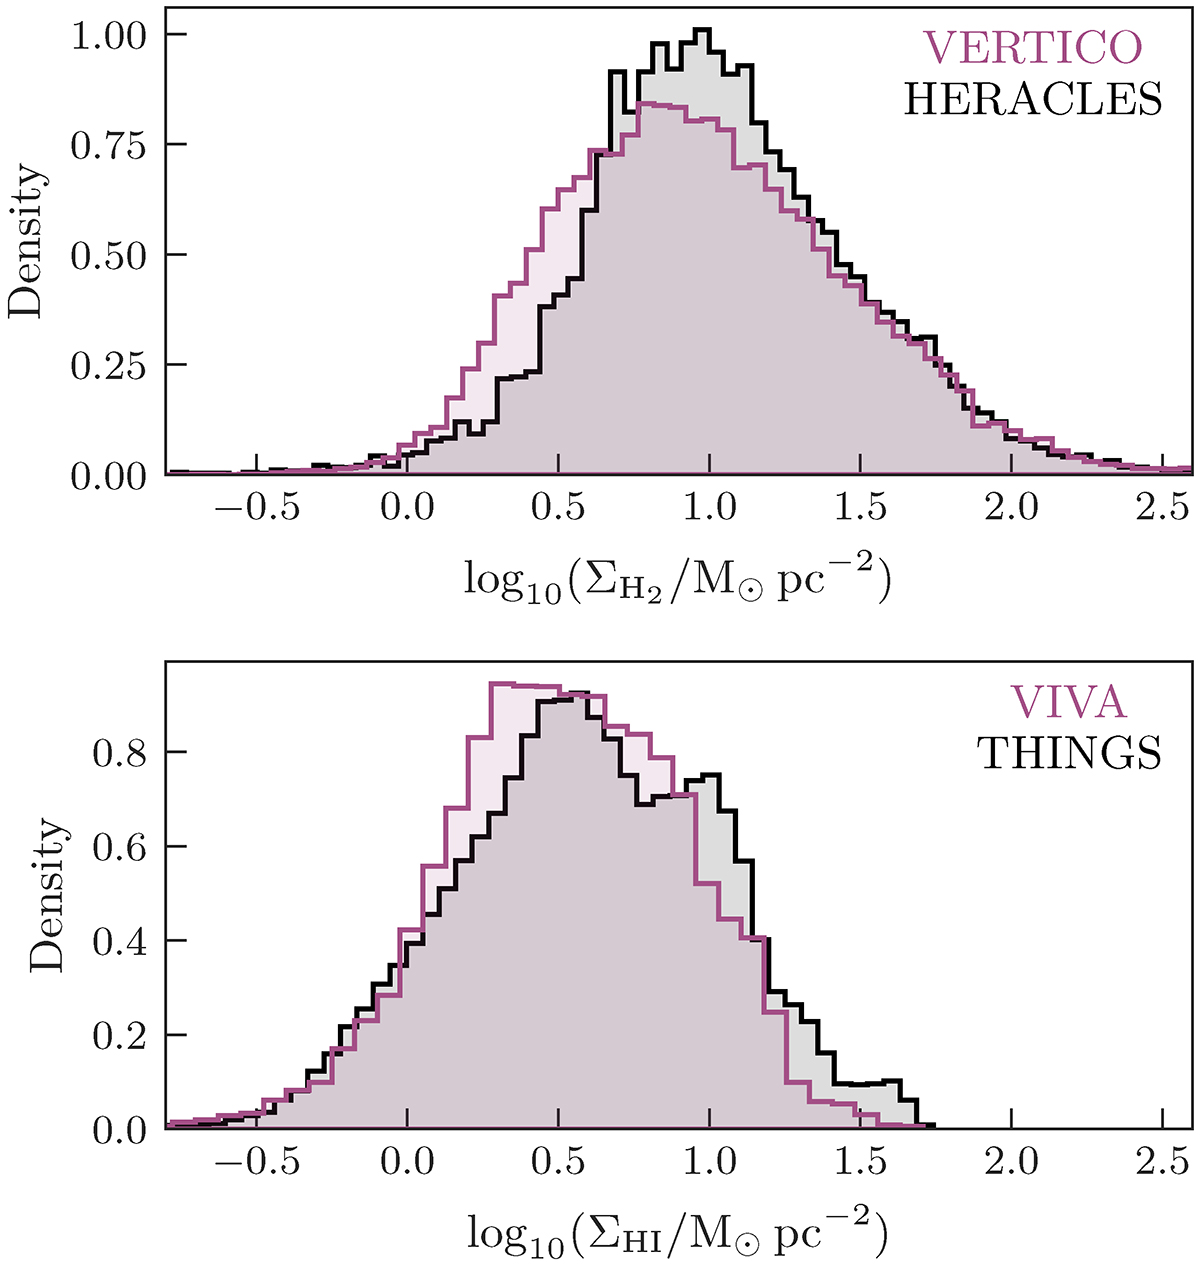
Fig. 2.
Download original image
H2 (top) and H I (bottom) surface density distributions for detected pixels in the gas surface density maps of the Virgo (magenta) and control sample (black) galaxies used for the asymmetry analysis (see Table 1). H2 surface density distributions are taken from the 720 pc resolution maps, and H I surface density distributions are taken from the low-res maps, with resolutions between 1.20 and 2.08 kpc for VIVA and a common resolution of 1.4 kpc for THINGS. Bin widths are set according to ‘Knuth’s rule’ (Knuth 2006) using the histogram functionality within astropy.visualization. The Virgo and control samples cover similar ranges of gas surface densities, both in terms of H I and H2.
Current usage metrics show cumulative count of Article Views (full-text article views including HTML views, PDF and ePub downloads, according to the available data) and Abstracts Views on Vision4Press platform.
Data correspond to usage on the plateform after 2015. The current usage metrics is available 48-96 hours after online publication and is updated daily on week days.
Initial download of the metrics may take a while.