Fig. 1.
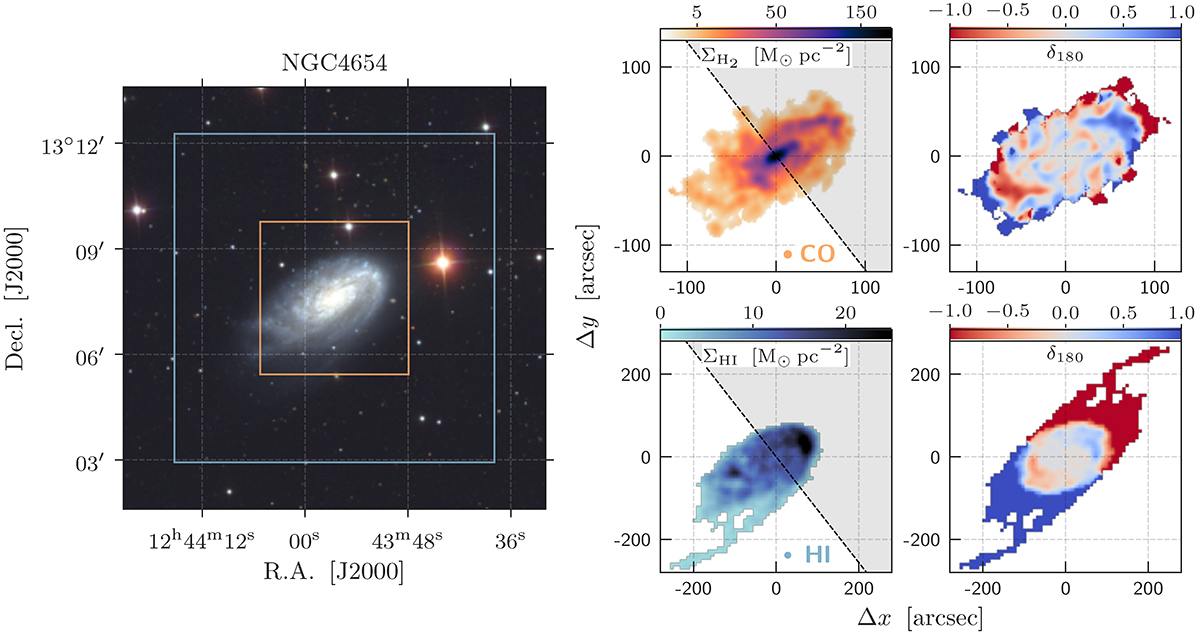
Download original image
Example images for NGC 4654. Left: optical gri image of NGC 4654 from the Sloan Digital Sky Survey (e.g., York et al. 2000; Blanton et al. 2017). The orange box corresponds to the CO image area, and the blue box corresponds to the H I image area. Right: gas surface density maps and asymmetry difference maps for the VERTICO CO image (top, 9″ beam) and the VIVA H I image (bottom, 16.9″ × 16.7″ beam). Overlaid on the gas surface density maps, we show the division between the leading half (shaded) and trailing half (not shaded) for NGC 4654 as used in Sect. 4 (Lee et al. 2022c).
Current usage metrics show cumulative count of Article Views (full-text article views including HTML views, PDF and ePub downloads, according to the available data) and Abstracts Views on Vision4Press platform.
Data correspond to usage on the plateform after 2015. The current usage metrics is available 48-96 hours after online publication and is updated daily on week days.
Initial download of the metrics may take a while.