Open Access
Fig. 1.
Download original image
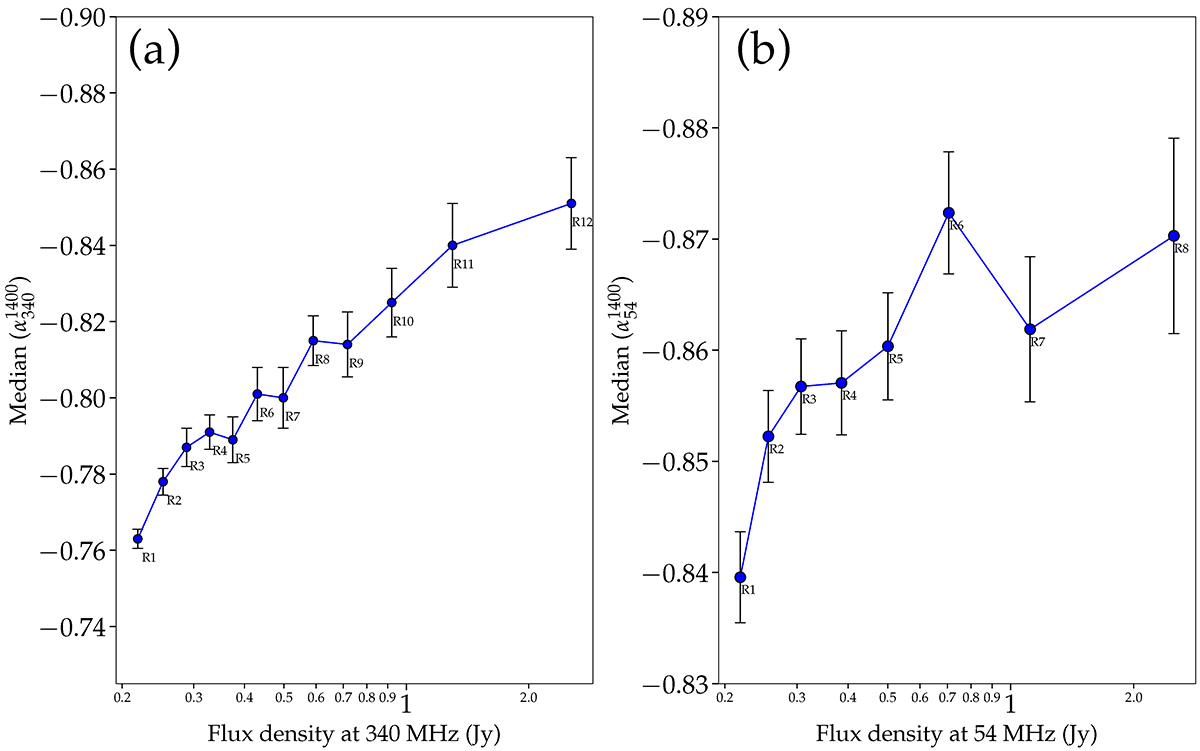
‘Spectral index-flux density’ relation for two different frequency samples. (a): αmedian − S340 MHz plot (Sects. 2 and 3.1), with the data for each of the 12 flux density bins listed in Table 1. (b): αmedian − S54 MHz plot (Sects. 2 and 3.2), with the data for each of the eight flux density bins listed in Table 2.
Current usage metrics show cumulative count of Article Views (full-text article views including HTML views, PDF and ePub downloads, according to the available data) and Abstracts Views on Vision4Press platform.
Data correspond to usage on the plateform after 2015. The current usage metrics is available 48-96 hours after online publication and is updated daily on week days.
Initial download of the metrics may take a while.