Fig. 7
Download original image
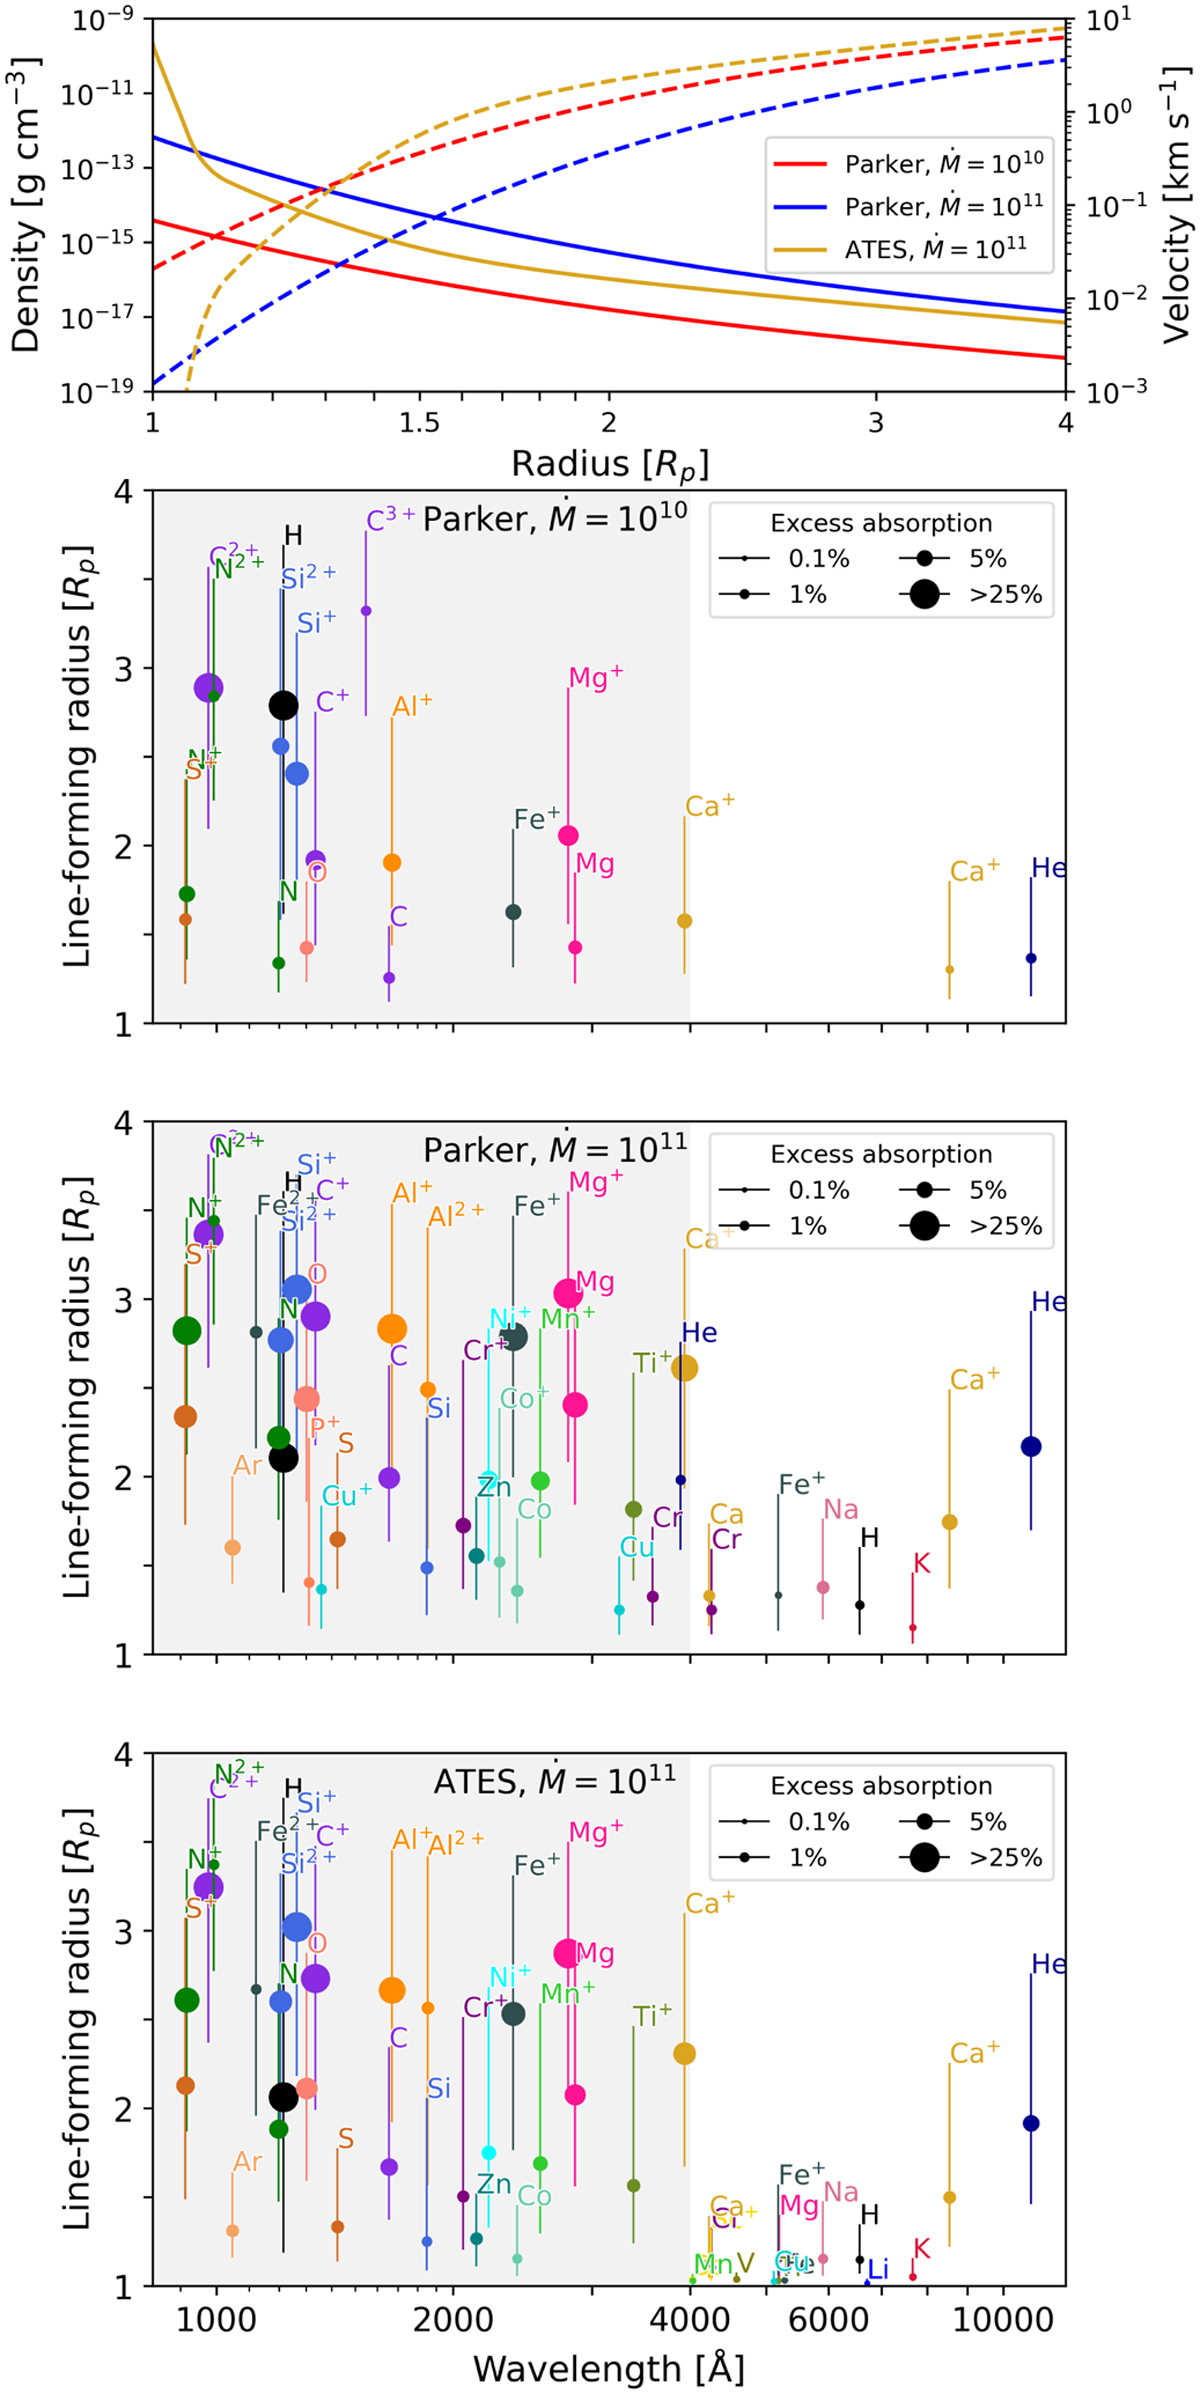
Line-forming radii for the hot Jupiter planet around a G2 star for different outflow profiles and with calculations truncated at 4 Rp. The top panel shows the density and velocity profiles (dashed). The second panel shows the result for a Parker wind profile with Ṁ = 1010 g s−1 and T = 8000 (same system as in the upper right panel of Fig. 3, but now stopped below the Hill radius). The third panel shows the result for a Parker wind profile with Ṁ = 1011 g s−1 and T = 8000. The bottom panel shows the results for ATES, which predicted a mass-loss rate of Ṁ = 1011 g s−1. We find additional lines at small radii (≲1.1 Rp) when using ATES because its density profile increases steeply in the lower atmosphere.
Current usage metrics show cumulative count of Article Views (full-text article views including HTML views, PDF and ePub downloads, according to the available data) and Abstracts Views on Vision4Press platform.
Data correspond to usage on the plateform after 2015. The current usage metrics is available 48-96 hours after online publication and is updated daily on week days.
Initial download of the metrics may take a while.