Fig. 2
Download original image
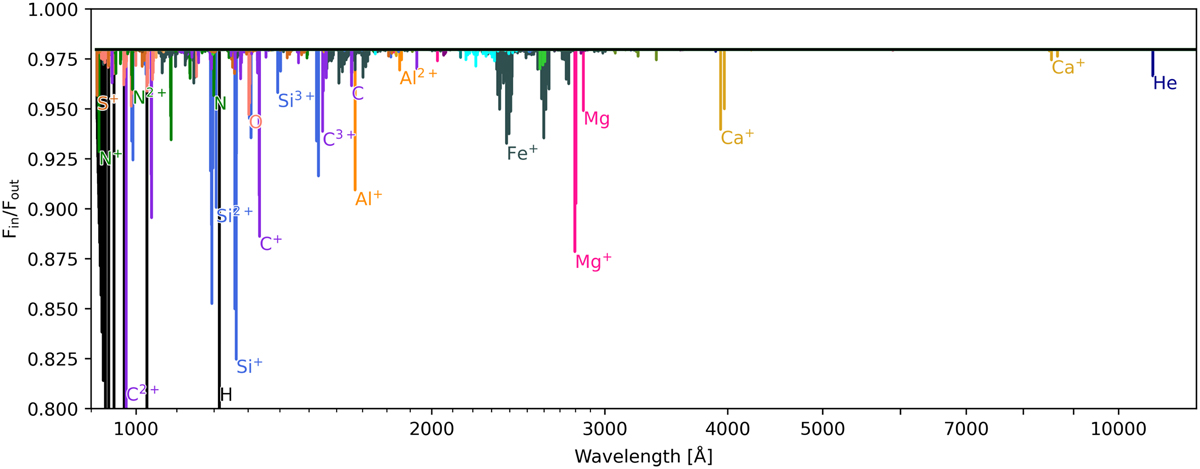
Transmission spectrum of the hot Jupiter planet around a G2 star, for a Parker wind profile with Ṁ = 1010 g s−1 and T = 8000 K. The strongest line of each atomic and ionic species is marked if it exceeds our thresholds of 1% at λ < 4000 Å and 0.1% at λ > 4000 Å and its line-forming radius is shown in the top right panel of Fig. 3.
Current usage metrics show cumulative count of Article Views (full-text article views including HTML views, PDF and ePub downloads, according to the available data) and Abstracts Views on Vision4Press platform.
Data correspond to usage on the plateform after 2015. The current usage metrics is available 48-96 hours after online publication and is updated daily on week days.
Initial download of the metrics may take a while.