Fig. 1
Download original image
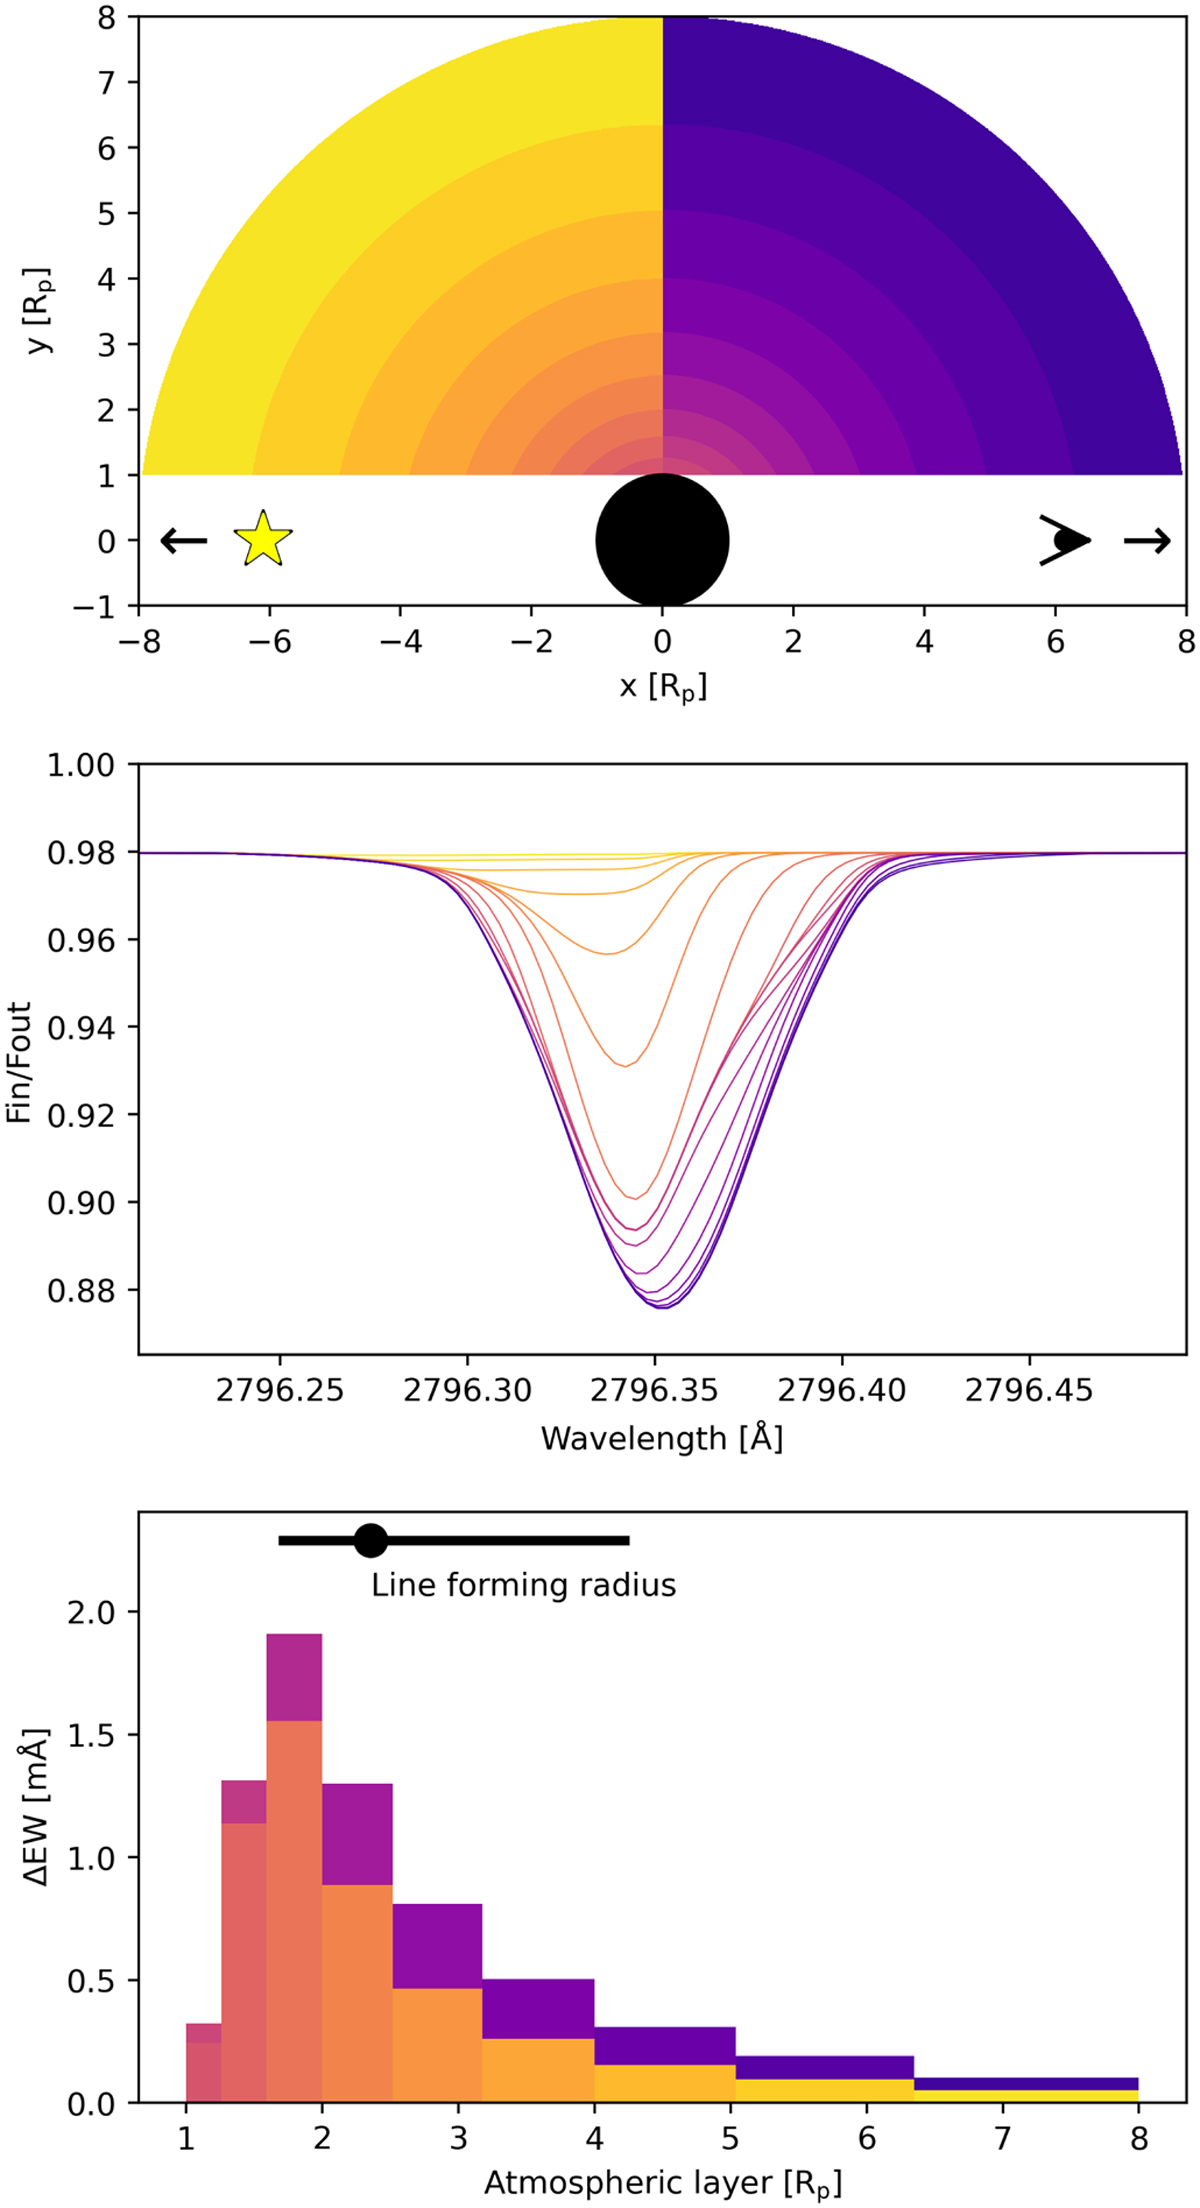
Illustration of how the line-forming radius is defined for the Mg II line at 2796 Å. We consecutively keep adding deeper atmospheric layers and track the increase in equivalent width (EW) of the spectral line. Top panel: 2D projection of the atmosphere separated into different layers (indicated by different colors). We show 18 layers for clarity, but our real calculations consist of 60 layers. The planet is indicated by the black circle. The star is to the left and the observer to the right. Middle panel: “observed” spectral line when only including the part of the atmosphere with the corresponding color as well as lighter shaded layers (i.e., more yellow layers). Bottom panel: contributions to the EW of the line from each atmospheric layer. The black point indicates the line-forming radius and standard deviations that are calculated based on the histogram and defined in Eqs. (1) and (2) (the plotted ΔEW value of the black point is meaningless).
Current usage metrics show cumulative count of Article Views (full-text article views including HTML views, PDF and ePub downloads, according to the available data) and Abstracts Views on Vision4Press platform.
Data correspond to usage on the plateform after 2015. The current usage metrics is available 48-96 hours after online publication and is updated daily on week days.
Initial download of the metrics may take a while.