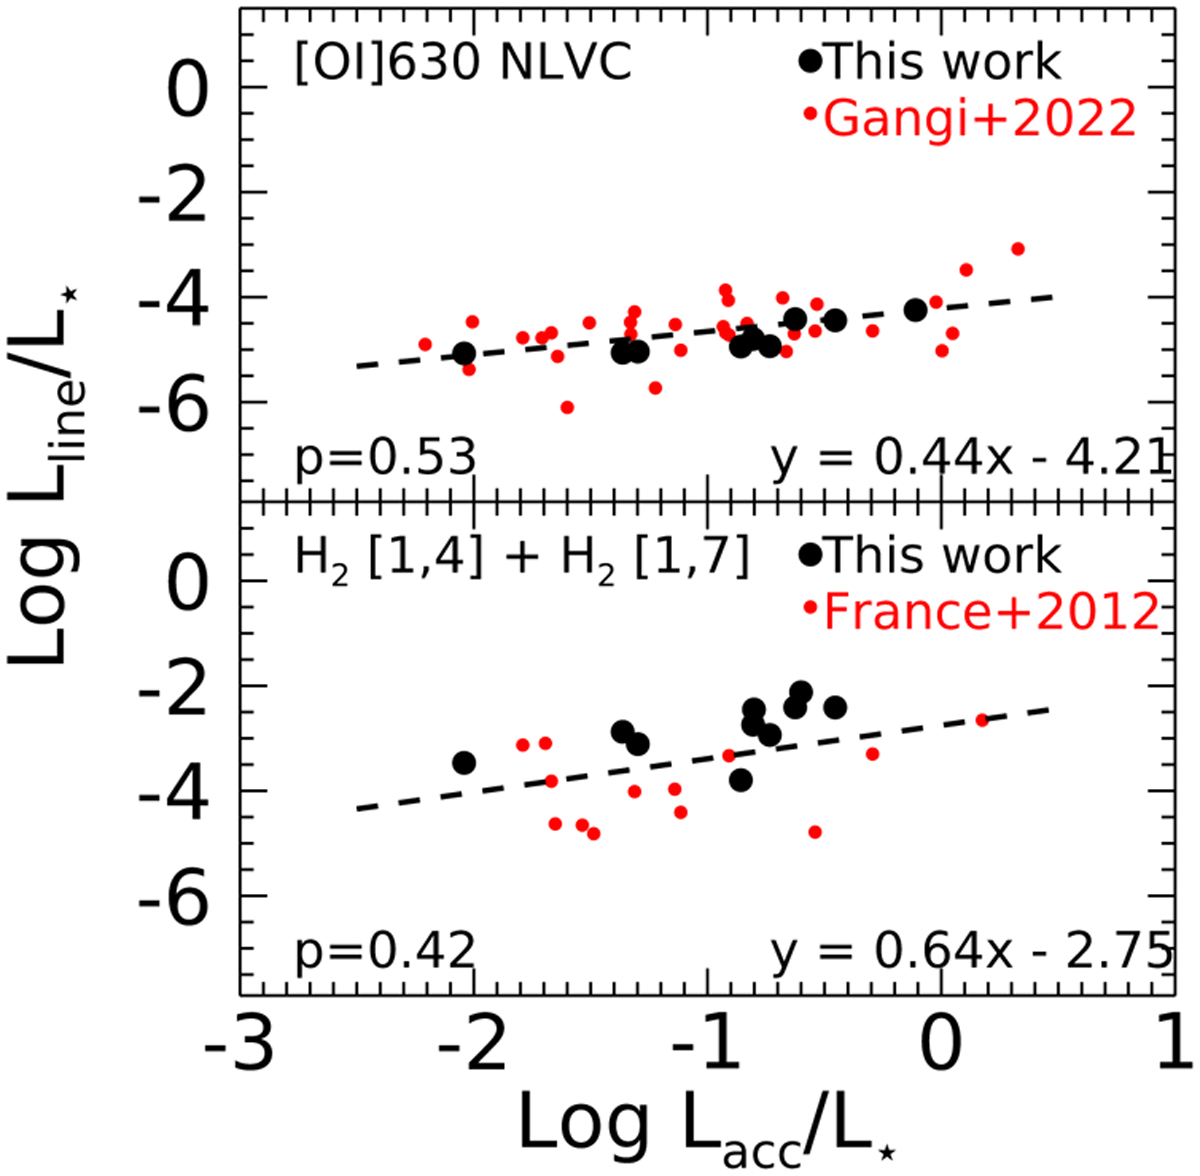
Fig. 7
Download original image
Line luminosity as a function of accretion luminosity. Both quantities were normalized to the stellar luminosity. From top to bottom: [O I]630 NLVC and H2 [1,4] and [1,7] sum. Red dots indicate values found in Gangi et al. (2022) and France et al. (2012) for a sample of CTTs in the Taurus-Auriga association. Linear fits to the all data points are marked by dashed lines. The analytical solution and Pearson coefficients are also labeled.
Current usage metrics show cumulative count of Article Views (full-text article views including HTML views, PDF and ePub downloads, according to the available data) and Abstracts Views on Vision4Press platform.
Data correspond to usage on the plateform after 2015. The current usage metrics is available 48-96 hours after online publication and is updated daily on week days.
Initial download of the metrics may take a while.