Fig. 6
Download original image
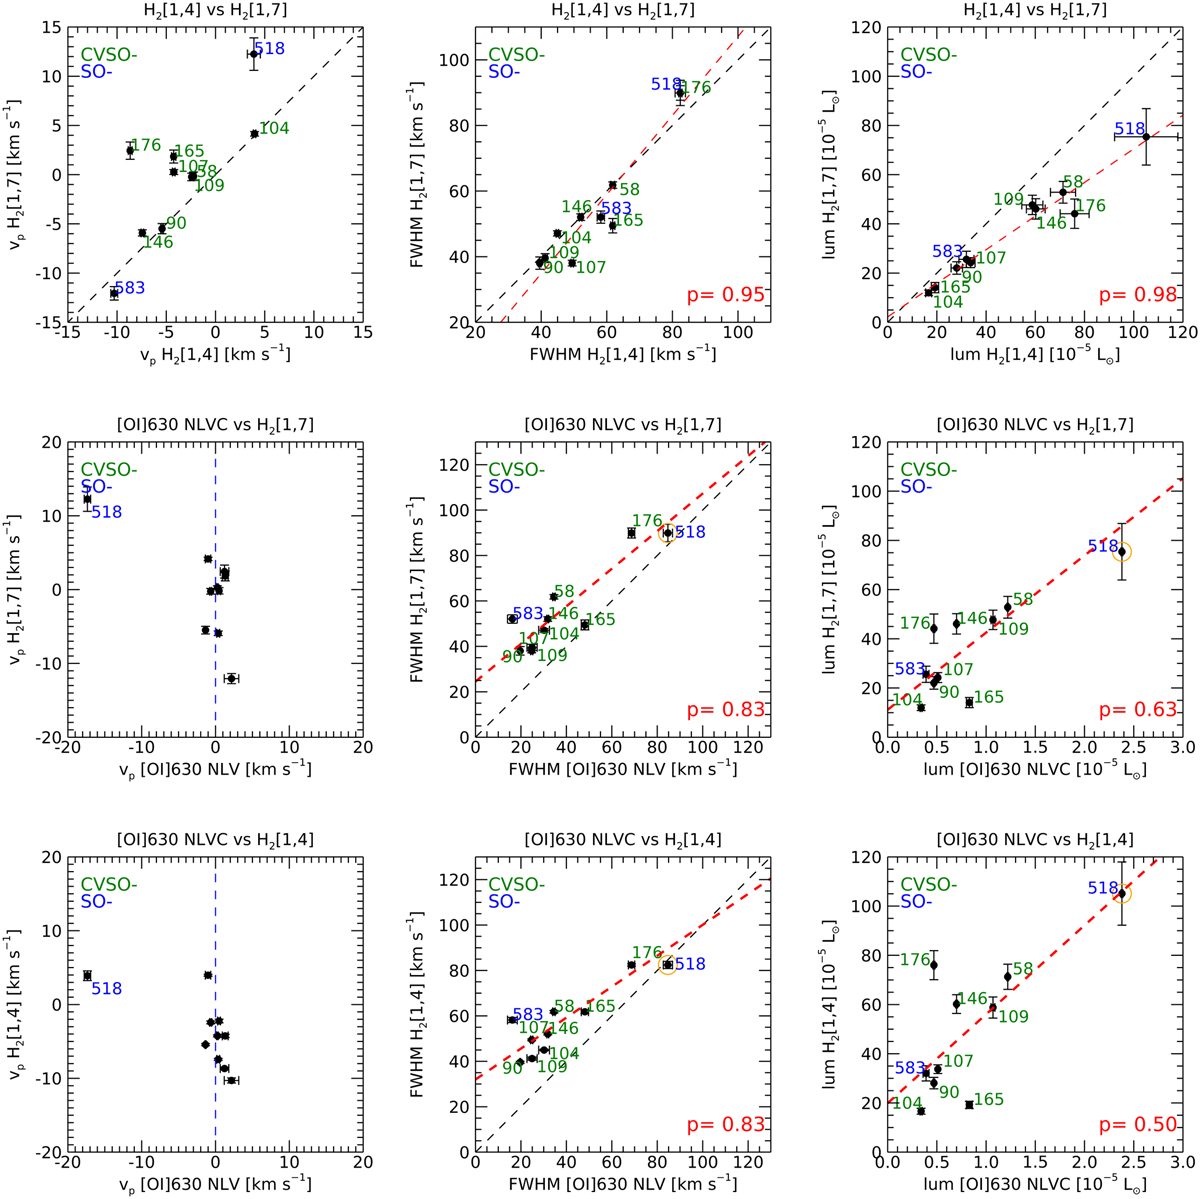
Correlations between kinematic and luminosity properties of the [O I]630 NLVC and UV H2 lines. From top to bottom: H2 [1,7] versus H2 [1,4], H2 [1,7] versus [O I], and H2 [1,4] versus [O I]. The black dashed lines represent the one-to-one correlations, while linear fits are shown as red dashed lines. The SO518 source (orange circled point) was excluded from the fit (see Sect. 5.1 for details). The Pearson coefficients are also reported. The vp errors on H2-UV lines reported in these plots are those resulting from the Gaussian decomposition procedure (Sect. 3). The estimated ~15 km s−1 uncertainty due to the wavelength calibration of COS should be added in quadrature.
Current usage metrics show cumulative count of Article Views (full-text article views including HTML views, PDF and ePub downloads, according to the available data) and Abstracts Views on Vision4Press platform.
Data correspond to usage on the plateform after 2015. The current usage metrics is available 48-96 hours after online publication and is updated daily on week days.
Initial download of the metrics may take a while.